
Just the Stats: 10 Usage Trends to Know for 2026


After years of writing fantasy football articles, there are moments when I question if the best medium for football discussion is “talking it out” in writing.
I recently wrote an article title “Is Fantasy Football Hard?” that allowed me a chance to open up more conversationally about the nuances of this silly game. However, I recognize that we inhabit a world that loves bite-sized clips, reels, and quick-hitting lists sometimes at the expense of truly taking the time to develop depth on a subject.
With an onslaught of information freshly given to us as football is happening on a Sunday, it might bring up a myriad of questions:
- Did the team change how they were running the offense?
- Why is my RB not in the game?
- When they get in the red zone, why is that WR not on the field?
- He ran a ton of routes. Why did he not get the ball?
- How did that WR suddenly catch a deep TD?
Every Monday during the NFL season, I plan on writing an early AM breakdown of ten usage stats, scheme changes, and oddities from the previous week of the NFL. The goal is to give you a rapid fire unfiltered look at how we digest a Sunday’s-worth of action and try to start deciphering what is valuable and what is not.
My goal is to hand you the data as a starting point in reflecting on what just happened. WARNING: It is tempting to take EVERY piece of data and form it into an actionable take. Sometimes data is there to sit with. Sometimes a statistic is there to make you think. Other times there will be quick-hitting takeaways. This weekly article will give you the information and not always try to solve the equation on a Monday when we need so much more time to zoom out.
Here are ten categories of statistics that I plan on charting every week during the season on our site.
1. Personnel Changes
The NFL is more fluid than we realize. Over the last decade, NFL teams hired 70 different head coaches. Only 33 hires had NFL offensive play-calling experience (47%) and those numbers will be put to the test in 2026. With 10 new head coaches and 21 new OCs, perhaps we should be more open to the fact we do not know these teams as well as we might think.
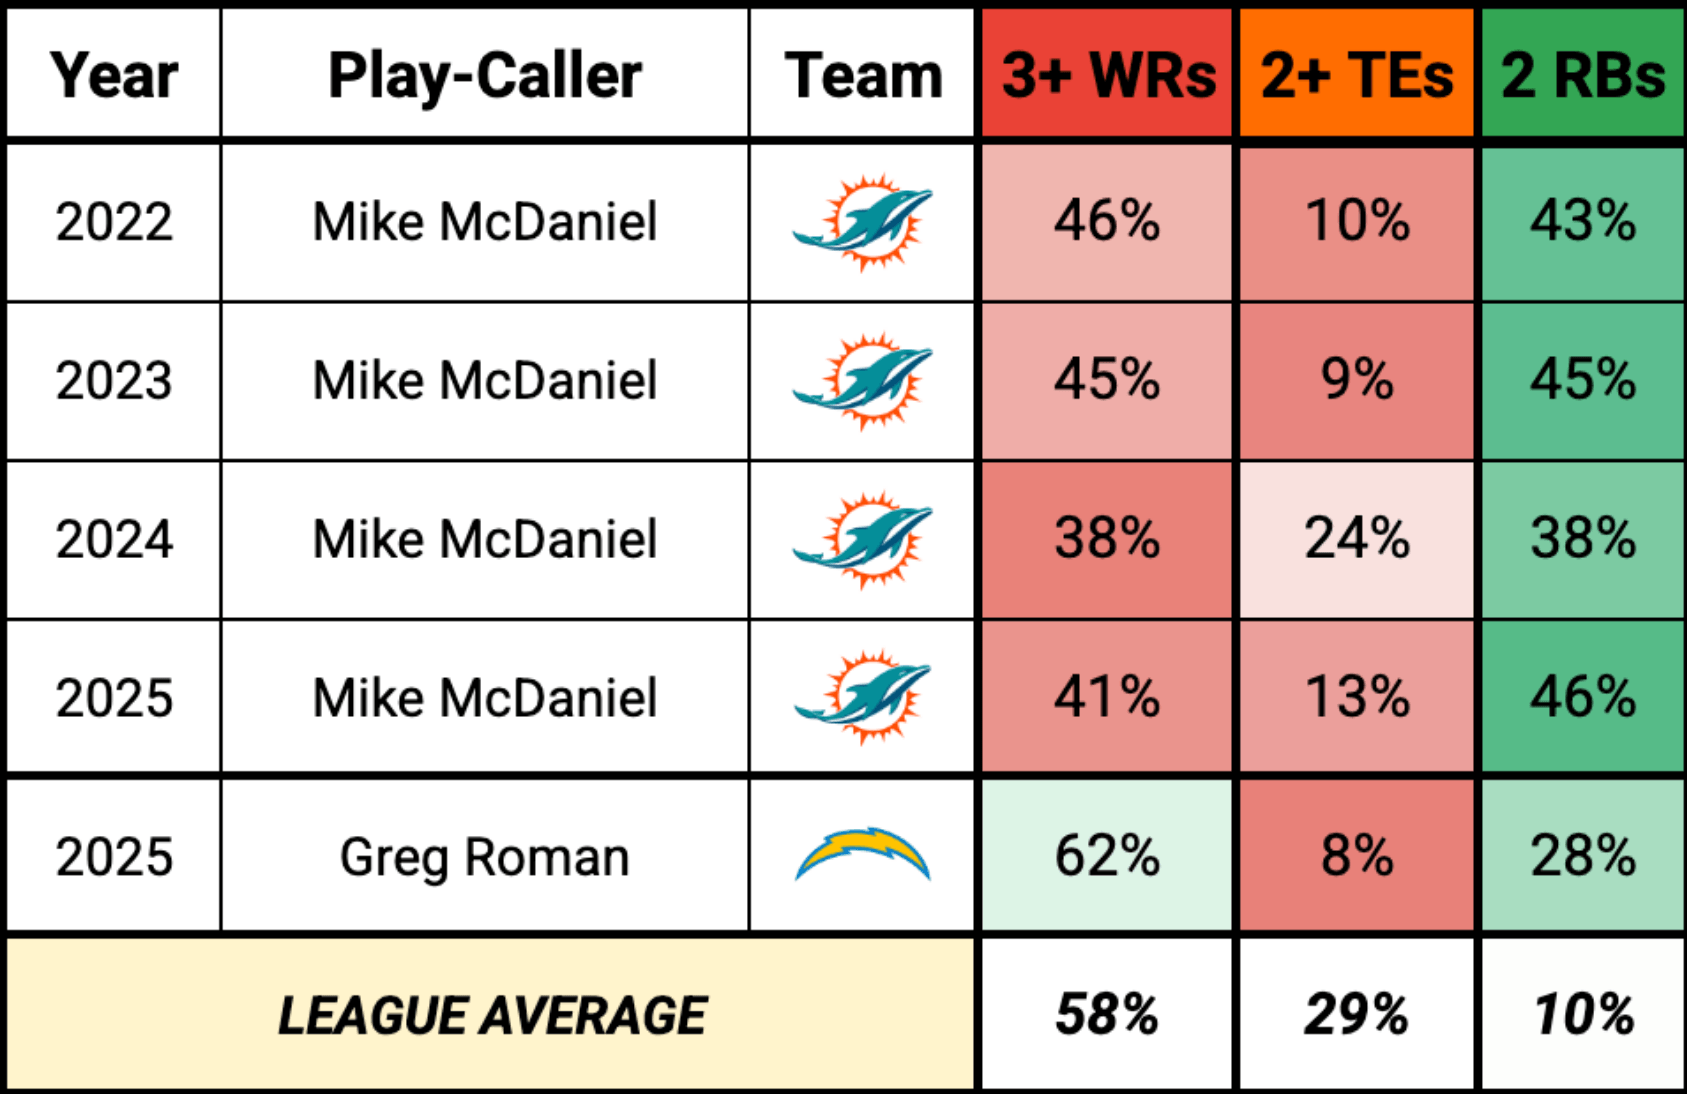
The Chargers offense might be one of the bigger storylines of this off-season. Last year under Greg Roman, the offensive line was decimated by injuries and yet Herbert became the 1st QB since 2018 (Deshaun Watson) to lead the league in % of drop backs pressured (43%) and make the NFL playoffs. They utilized 12-Personnel on just 6% of their offensive plays, the lowest rate in the NFL. It made sense considering they ranked DEAD LAST in rush success rate in 12 personnel last year.
On the other end, Mike McDaniel is a wilcard as he used 3 or more WRs on the field for just 41% of Miami’s plays, 3rd LOWEST in NFL in 2025. Things will change drastically for the Chargers in 2026 and we will be following along!
In Mike McCarthy’s final two seasons in Dallas, 83% of passes were with 3+ WRs on field. That rate was a bottom-tier 47% last year with Arthur Smith. The Steelers will look very different in 2026. The Ravens ran the ball on 55% of their “early downs”, the highest rate in the NFL. A change in OC (from Todd Monken to Declan Doyle) and losing multiple TEs, C Tyler Linderbaum, and FB Patrick Ricard might shift how the offense functions. Speaking of, did you know the 5 of the top 6 NFL teams in 21/22-personnel usage will have FB changes in 2026? The NFL does not stay status quo.
There will be some weeks where the statistics might be fairly straightforward such as the “Rams ran more 13-personnel snaps inside the red zone than the previous weeks” or something like “over the last month, the Commanders abandoned some of their 3WR sets”. The beauty of the NFL is that the games write the stories for us and provide the discussion week-in, week-out. I am here simply to give you the data for some of these personnel changes and allow you to adjust to the information.
2. Play-Action & Motion Usage
There are a couple of “easy buttons” coordinators can press when dialing up play calls. This chart by FantasyPoints might be the easiest illustration of which play callers are utilized motion and play-action in the optimal fashion:
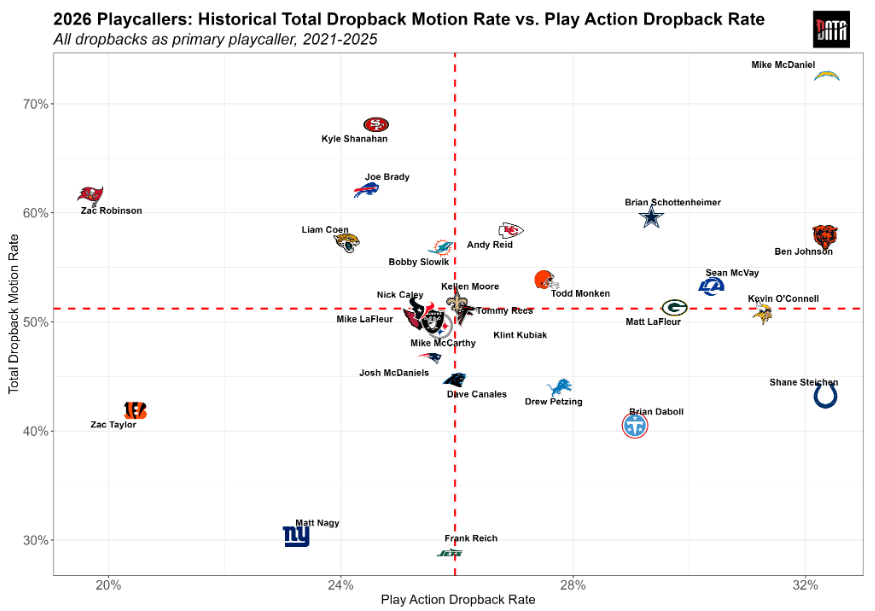
We will monitor the rates early on in the season but here are a few fun factoids from last year:
- Did you know Troy Franklin had as many receptions on play-action drop backs as Puka Nacua last year?
- Broncos HC Sean Payton ranked dead last in pre-snap motion rate at 43%.
- The Chiefs dropped to 25th in pre-snap motion and 30th in play-action rate last year, the lowest rates of the Patrick Mahomes era.
- Dalton Kincaid led all TEs with a 4.85 YPRR when put in motion.
- Versus play-action, the Rams defense ranked 28th in completion percentage (72%) but only allowed three passing TDs (2nd best) over the course of the season.
3. Per-Route Metrics
It would not be a statistics article without bringing in our old friends Targets per Route Run (TPRR) and Yards per Route Run (YPRR).
It can be hard to zero in on a couple of metrics and proclaim, “These are the ones worth paying attention to!” There are deeper studies out there (highly recommend Ryan Heath’s chart on stable & predictive stats) but for the sake of this article, we will focus on routes-based data.
We talk all the time about how targets are earned; they show skill. Routes give context because they mix in opportunity (or lack thereof) for a WR. It is worth noting that route data is not widely available and is often found behind paywalls. Why? It is data and sites like PFF or FantasyPoints have put in a ton of time and hard work collecting this data. Do them a favor and subscribe or at least acknowledge that tracking every single route in every single game in the NFL takes time and a desire for accuracy.
Yards per Route Run (YPRR) gives a well-rounded figure to work with as we are able to simply divide the total receiving yards by the number of routes they run on the field. It is less prone to outlier skewed stats (Yards per Target, Yards per Reception) but it’s not perfect. YPRR needs roughly 11 games or 180+ routes to start to stabilize for WRs.
I do need to caution that YPRR inherently is biased as Underdog’s Hayden Winks noted. Some run-heavy teams (like the Falcons or Ravens) routinely trot out two or fewer WRs while teams like the Rams use 11-personnel like it’s going out of style.
Overall, YPRR is heavily influenced by the number of WRs on the field and there are attempts to produce expected YPRR and adjusted YPRR figures as Tej Seth of SumerSports details. For the sake of this study, we will begin with the simple YPRR metric to compare past draft classes.
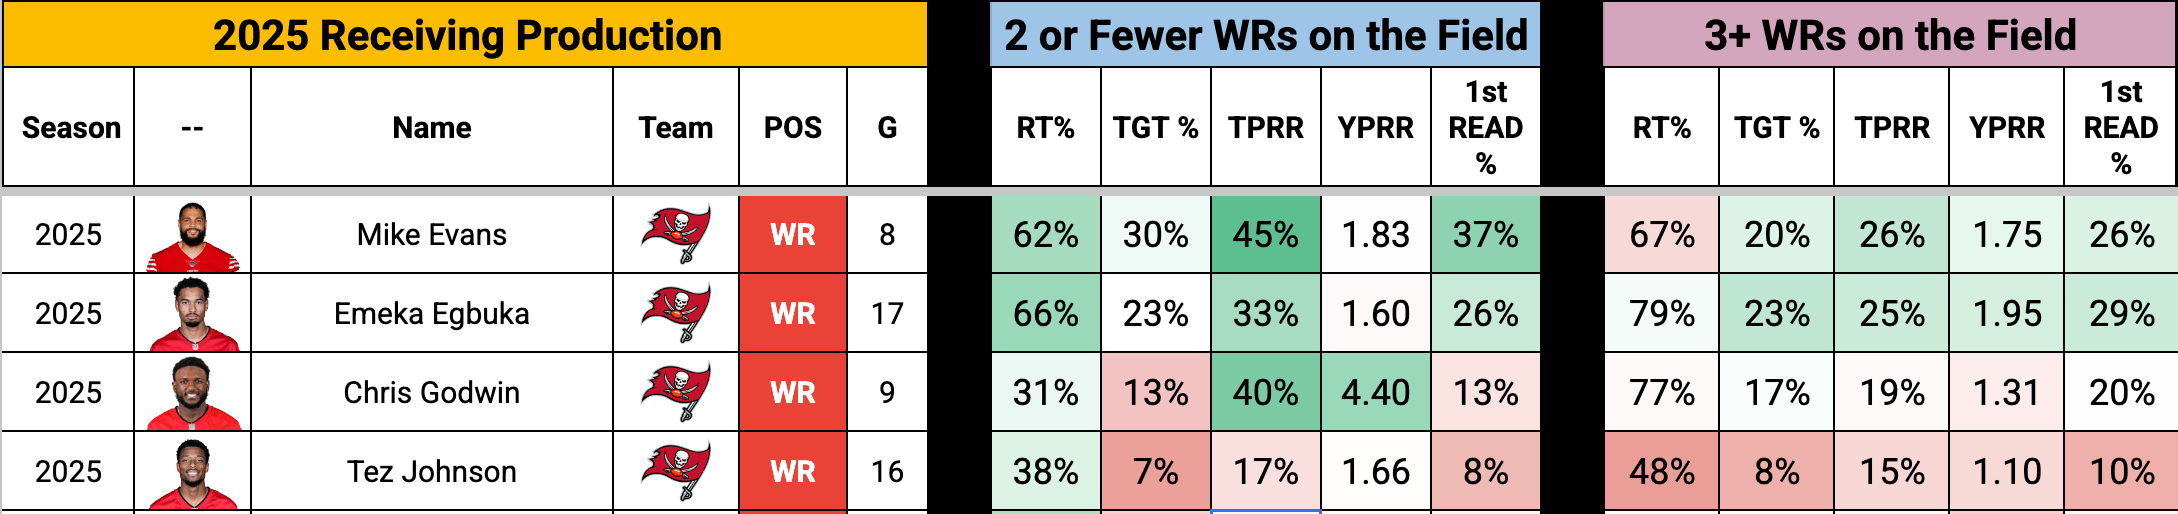
Targets per Route Run (TPRR) is another metric we discuss frequently on the Fantasy Footballers podcast. It measures how involved a player is and weeds out cardio kings such as Marquez Valdes-Scantling who might be the best-conditioned players on the field but shots in the dark for fantasy. TPRR closely follows target share but it gives us an even deeper look at team opportunity. When this player is running route, how often does their QB look their way? You might’ve seen the highlight of a long 60-yard TD the week before but when you peel back the curtain, MVS might’ve been targeted just 10% of the time, an atrociously low figure. I wrote a primer on this stat back in 2021 and one of our writers (AJ Passman) does a weekly article in-season.
Anything sub 20 percent is not optimal when you compare it to other WRs. At its core, TPRR is a measure of efficiency; it tells us a player’s ability either to get open or be a part of the offensive scheme. We say it often: earning targets is a skill. And that skill, expressed as TPRR, has a strong correlation with fantasy relevance. Since 2006, 92% of receivers who finished as a WR2 or better (top 24) had a TPRR of at least 20%.
4. RB Routes & Pass Blocking
This one feels personal. I’ve written a lot about the RB position over the years including an article that was a FSWA Article of the Year finalist in 2023: “The Myth of Third Downs, Fantasy RBs, and Where Do We Go From Here?“.
As a follow up, keep in mind some of this data overlaps (a 2 min drill can be an early down or a 3rd down, etc.)
While 2 min drills feel impactful, targeting that role feels ancillary considering we are all terrible at predicting game flow and it carries a lower TPRR & FP/RR. https://t.co/0XOMNy1zmF pic.twitter.com/FtyVpQyhkD
— Kyle Borgognoni (@kyle_borg) August 19, 2026
We put so much stock into who the third down back could be for each team but the overwhelming signal for fantasy football is early down work. Why? Early downs happen more frequently, RBs are targeted there more often, and as I’ll mention below, they run more routes on early downs than we realize.
The pass-blocking argument for any player is always a bit subjective. More snaps is always a good thing especially when the snap rates at the end of a game tell us a lot about our fantasy outlook. But keep in mind the snaps an RB gets “pass-blocking” are registering ZERO fantasy points. Nada. Zilch.
Routes gives us the strongest relationship with fantasy points BUT there is a caveat… is this RB also pass-blocking a ton? This in fact had negative correlation across the board.
- Pass Block %– What percentage of pass plays was this RB asked to block? This factors in only plays the RB was present on the field, not total team pass plays. This gives us a better understanding of how often an RB is NOT participating in a called pass play.
- True RB Target Rate (TruTgt%)- This takes TPRR and goes a step further for the RB position. Instead, take their targets and divide by the number of pass plays they were on the field, not mere routes. If pass blocking for an RB highlights their lack of availability, it should be counted against them, not for them as you’ll see below.
5. TE Routes & Pass Blocking
We can all agree that you cannot catch a pass by not seeing a target and you don’t see a target if you’re not running a route and you’re not running a route if you’re pass-blocking. Get it?
For the TE position, you can focus on a few defining statistics that the top dogs all have in common:
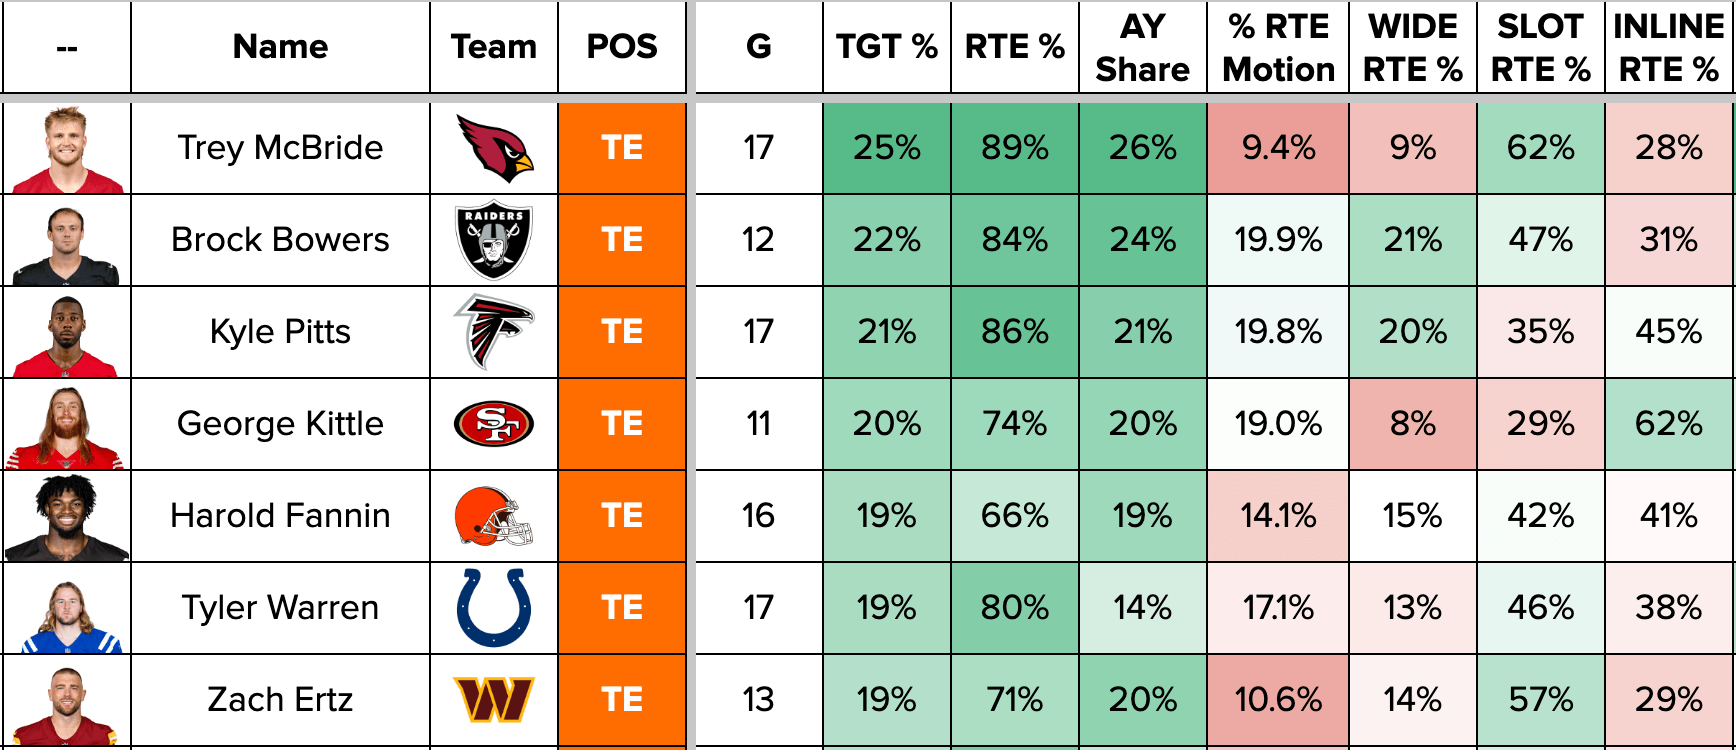
We looked at the last 7 years of data and here are 3 of the stats worth highlighting:
- Target Share – Good ole Target Share is a go-to on the show because it not only is explainable for so many listeners but it is predictable! Targets have the highest correlation year-to-year for fantasy simply by acknowledging how involved a player will be and how much percentage of the passing pie they get. Looking for 17+ % target share, preferably closer to 20%
- Route Share- when they are on the field for a pass play, are they blocking or running a route? With the move to so many 12 & 13-personnel teams, you need to know what TYPE of TE you are dealing with: Is this a blocker? Inline only? Slot Snaps? Hybrid? Looking for 70+% of the routes for a top-10 TE/ 75+% for top-6
- Air Yards Share- shows down field potential. Air Yards measure the distance a football travels through the air from the line of scrimmage to the target, whether the pass is caught or incomplete. We want downfield threats, not Austin Hoopers. Anything above 15% is solid for a TE.
6. Route Participation for WRs
It is one thing for a WR to be on the field. It is another for them to be deployed in a manner that matters for fantasy. I highly recommend this article from PFF’s Nathan Jahnke that details the ideal utilization for WRs as it relates to fantasy. The TLDR of that article is the pinnacle of fantasy production is found in the players who are the “lead X” in 2WR sets and the “lead slot” in 3WR sets. It is what makes CeeDee Lamb so special. It is also what frustrates us about Jayden Reed.
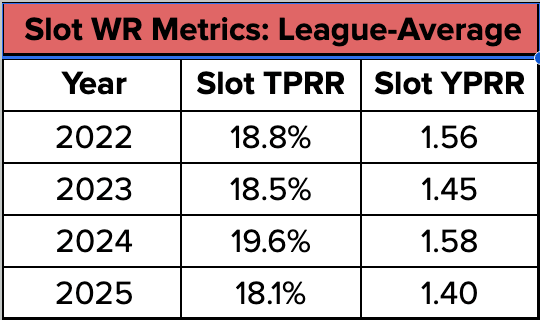
Slot WRs might be all the rage but their per-route metrics have actually been declining over the last couple of years.
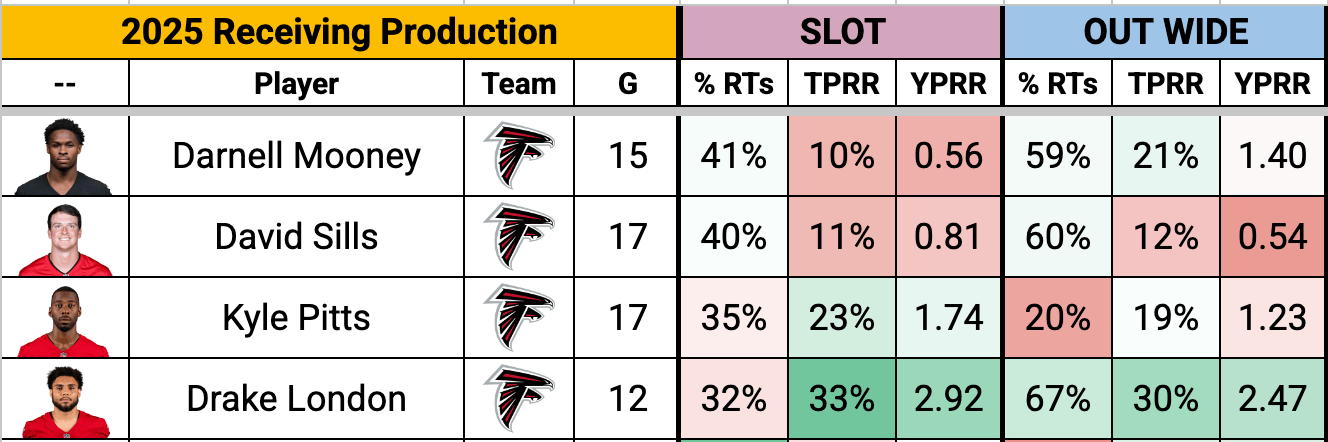
I will be differentiating where players have been more efficient. As you can see, Drake London crushes when moved into the slot but he ran roughly a third of his routes there in 2025.
7. Route Tree Changes for WRs
I cannot stress this enough: the NFL is an evolving game. Last year’s data will fail you if you continue to assume things will repeat.
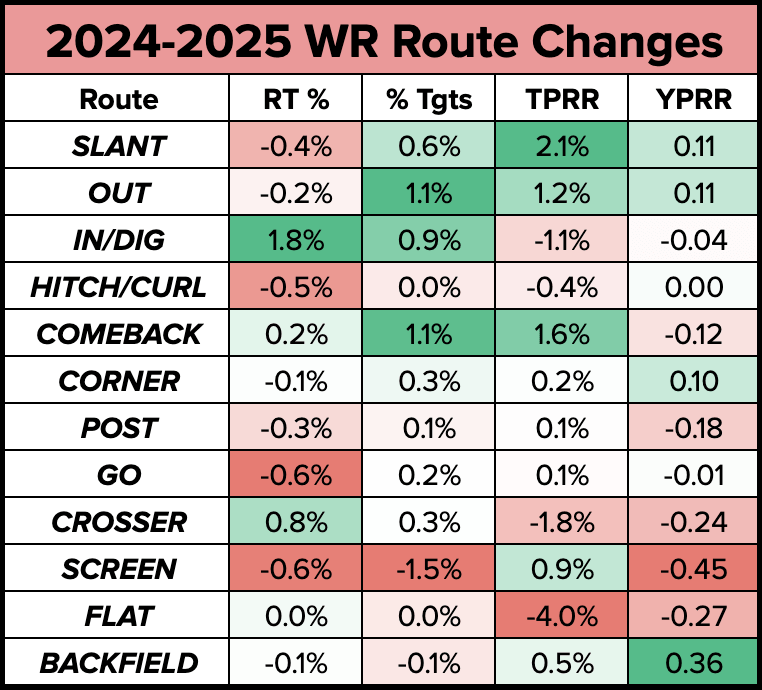
Even on a macro level, you can see how the NFL ebbs and flows. 2025 NFL WRs were less efficient with Crossers & Screen routes compared to 2024. Opposing defenses allowed fewer YPRR to crossers (-0.24 YPRR from 2024) and screens (-0.45 YPRR), something noteworthy.
Take for example Alec Pierce. Injury issues aside, we need to realize he was deployed in a different way in 2025. He is not running only “nine routes” he did earlier in his career. Last year, saw a big uptick in crossers and intermediate area routes. 55% of his routes were either Digs, Gos or Crossers, a unique combination of routes. That was the highest percentage of that route tree trio (I like that term!) of any WR with 50+ targets last year. Andy brought him up on the MVP episode Friday.
Or Brian Thomas Jr. In 2024, he was one of the most valuable NFL WRs on targets behind the line of scrimmage. He averaged 10.2 YAC/rec on 17 screens per PFF. In 2025, he had a screen target. As in one.
This is important: not every NFL route is equal. Some are used more frequently and others are less valuable.
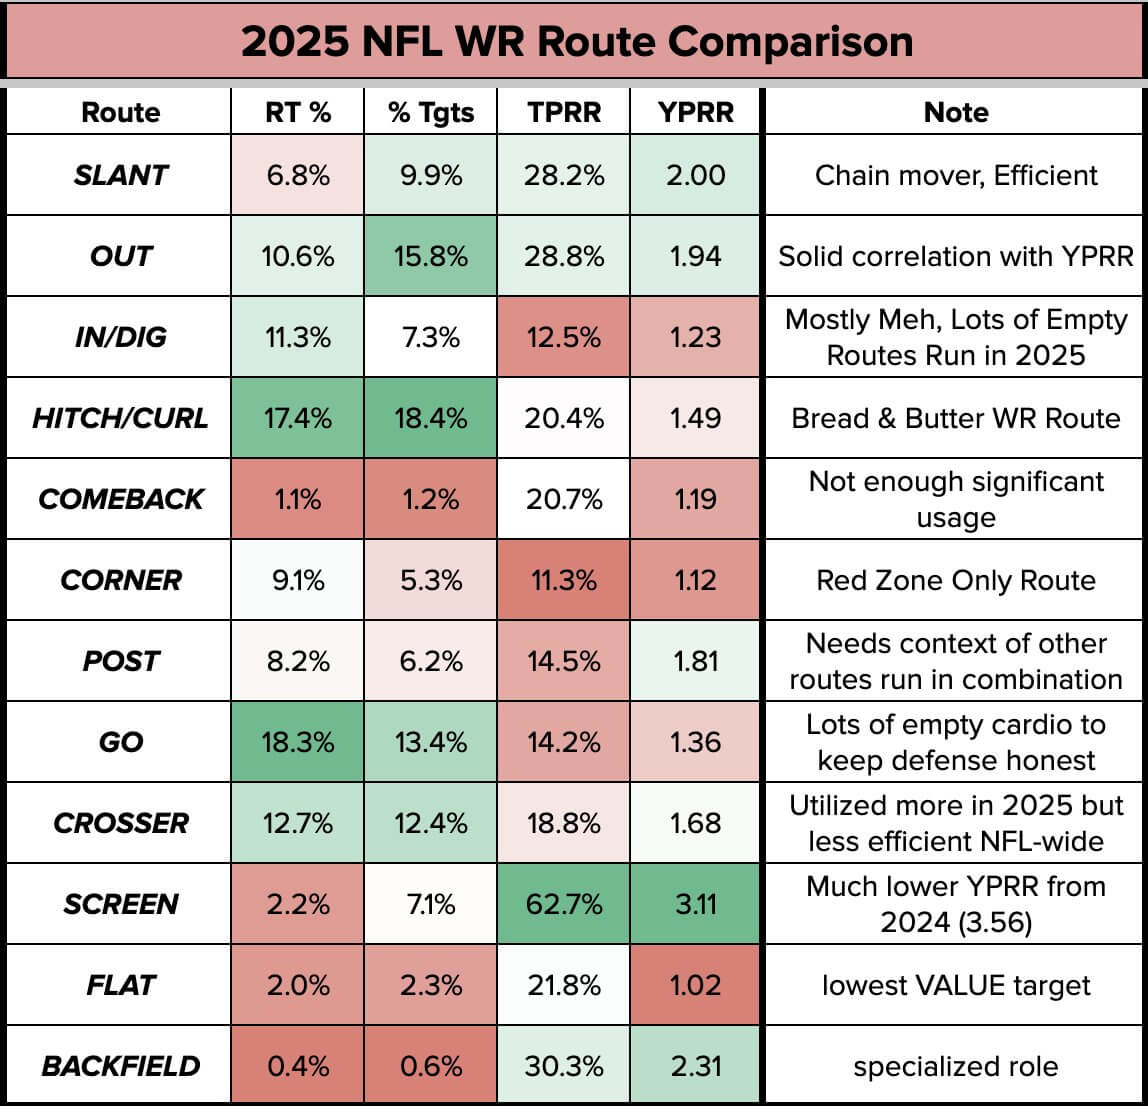
We also track which routes are used more heavily by certain teams. For instance, the Steelers ran 234 total slant routes last year, by far the highest rate in the NFL. However, they targeted players on a league-low 18.4% of those routes. You might’ve seen it show up a ton on film but it was not an effective route for the team. Take for example DJ Moore and the other end of the spectrum. The Bears as a team ran slants on just 2.5% of their routes, 30th in the NFL. Perhaps a change of scenery to Buffalo will allow him to see more “layup” targets as the alpha WR1. We will monitor those type of changes early in the year.
8. Red Zone Participation
With roughly 67% of all TDs occcuring inside the red zone over the last decade, it is so important to monitor which players are seeing the high value touches we want for fantasy. This condensed area also invites some absurdities:
- D’Andre Swift has run 63 total routes inside the red zone through two years with Caleb Williams as his QB. He has just one total target.
- From Week 9 on, Trevor Lawrence scored more fantasy points inside the 10-yard line than any other player.
- Christian McCaffrey had the largest discrepancy of any RB in terms of yards per carry (-0.71) inside the red zone versus outside.
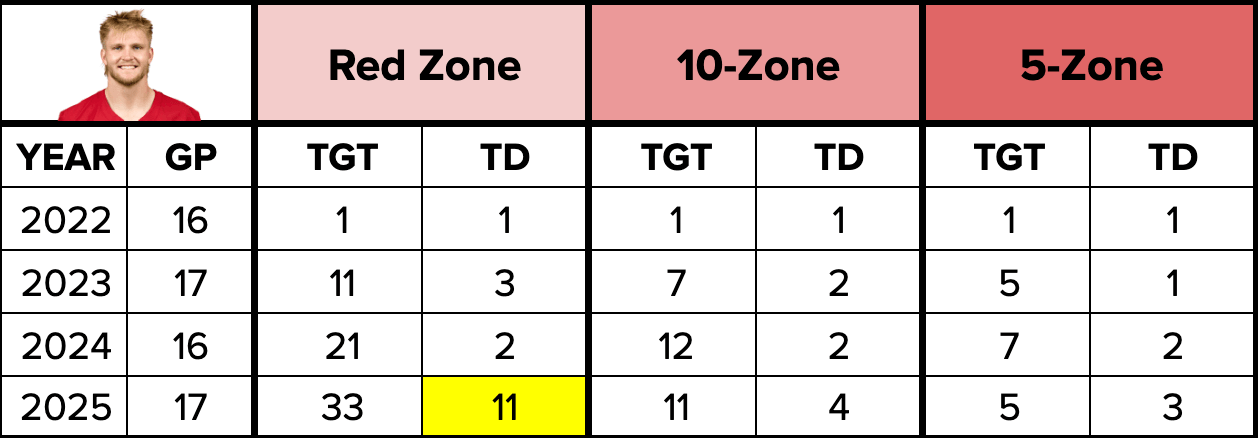
One of the stats I follow is which teams are dropping back to pass the most inside the 20 yard line. It presents opportunity if your team sustains a drive and is willing to throw when in close. The Cardinals, wildly enough, tied the Rams for most red zone drop backs per game (6.8) last year leading to an absurd 11 red zone TDs for Trey McBride.
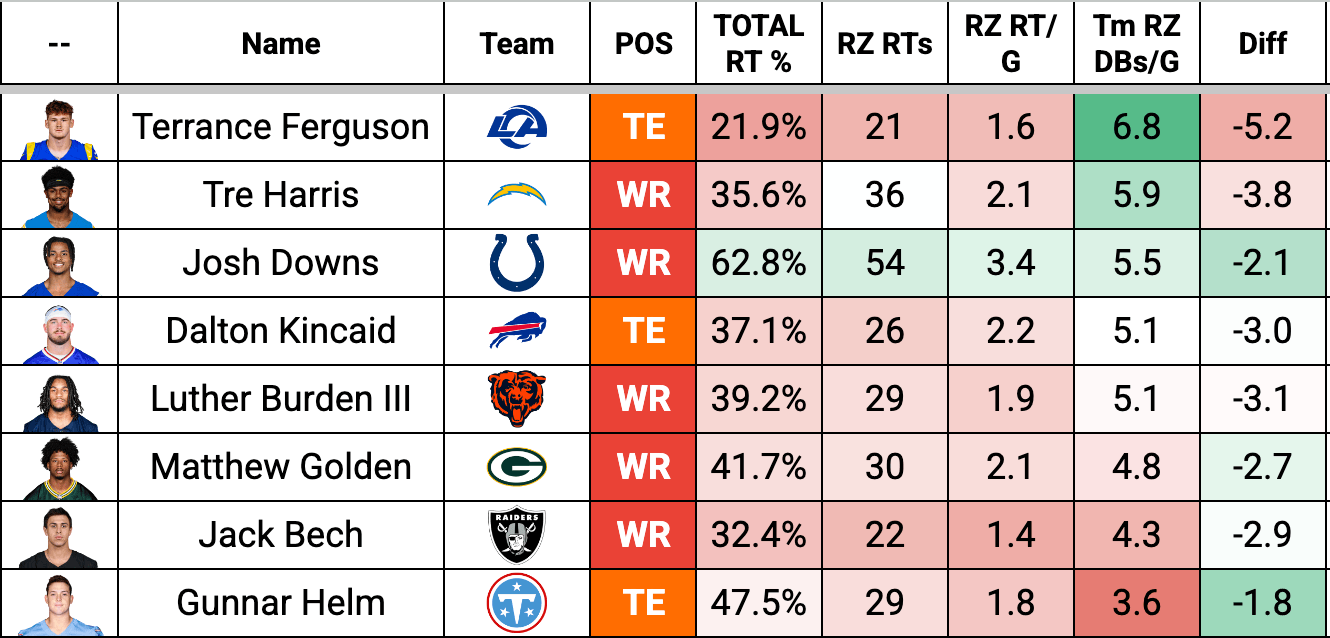
Here are some of the players I will be monitoring closely over the first couple of weeks to see if their role inside the red zone changes or not. For example, Terrance Ferguson ran 21 total routes inside the red zone last year, or roughly 1.6 per game. Why did that matter? He was missing out on valuable scoring opportunities as Colby Parkinson was the clear red zone dominator
9. Defensive Coverage Shifts
If offenses do not stay the same, why would defenses? I will monitor changes in defensive alignments such as when the Jaguars flip-flopped in 2024. They went from an extremely man-heavy unit in 2024 (42% of drop backs) to essentially abandoning it (18.4%) in 2025. That was the largest year-to-year shift among defenses last year.
Courtesy of FantasyPoints, here were the teams that ran man coverage on 30+ % of their opponent’s drop backs in 2025:
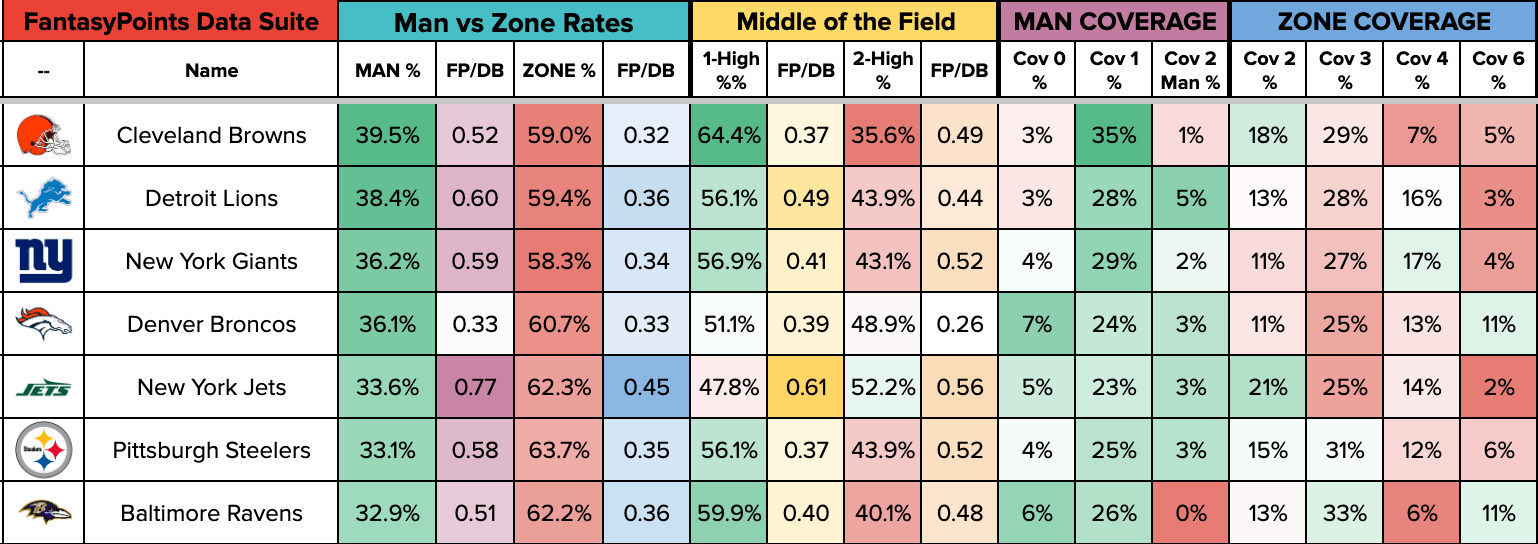
The goal is to see changes and be able to react rather than catching up to the crowd. For example, the Patriots defense “flipped the script” in the playoffs playing a ton of two-high safety looks (55%) and sitting in more Cover 4 (“Quarters”) than they had in the regular season.
10. Unneccessary Stats No One Asked For
I could not make a list without mentioning how much joy it brings to find odd statistics and share them with others. Heck, I basically created a career of doing this.
Did a Jets WR catch a ball on a Go route?
Wk 1- ❌
Wk 2-❌
Wk 3-❌
Wk 4- Garrett Wilson
Wk 5-❌
Wk 6-❌
Wk 7-❌
Wk 8-❌
Wk 9-❌ (bye week)
Wk 10-❌
Wk 11-❌
Wk 12-❌
Wk 13- AD Mitchell
Wk 14- AD Mitchell AND Isaiah Williams 🎉
Wk 15-❌
Wk 16-❌
Wk 17-❌
Wk 18-❌— Kyle Borgognoni (@kyle_borg) February 26, 2026