
How Much Do Offensive Lines Matter for Fantasy Passing Games? (Fantasy Football)


My man Samuel DiSorbo recently wrote “How Much Should Offensive Line Quality Impact Your Fantasy RB Decision Making?“, and it got me thinking about the more explosive part of the offense: the aerial assault. Does OL play impact the pass game enough to warrant heavy consideration in your fantasy strategy?
My hypothesis, before digging into the data, was “absolutely,” but as I worked through the thought exercise, I quickly changed it to, “Yes, but it is nuanced.” A separate question, but one you will need to evaluate for yourself, is the opportunity cost of this deep of a look.
As I learned to watch film through The Scouting Academy, I quickly learned that the depth of the details needed for a good scouting analysis does not translate directly to fantasy success. With that said, these exercises in pairing analytics with a film mindset are worthwhile when they reveal edge-generating efficiencies in fantasy decision-making.
The Metrics
Passing metrics are far more layered than rushing stats. While pressures, hits, blitzes, and sacks gauge pass-protection results, raw pressure metrics tell only half the story. Looking at all QB data with 250+ dropbacks in 2025, pressure-to-sack (P2S) rate correlates much more strongly to fantasy production than raw pressures (-0.42 vs. -0.06). Because sacks kill offensive efficiency, P2S is the ideal metric to leverage when factoring offensive line play into your QB evaluations – though it still demands contextual caution.
From P2S to QB Analysis
Once you sort your spreadsheets by P2S rate, you have to evaluate the passer. The highest P2S rates from 2025 highlight the risks of isolating this metric:
| PLAYER | TEAM | Games Played | Attempts | P2S Rate | 2025 FPts | Pressure FPts |
| Geno Smith | LV | 15 | 524 | 25.9 | 173.9 | 50.08 |
| Tyler Shough | NO | 11 | 378 | 25 | 158.0 | 31.88 |
| Drake Maye | NE | 21 | 755 | 23.9 | 352.0 | 91.24 |
| Cam Ward | TEN | 17 | 623 | 23.5 | 186.7 | 48.76 |
| J.J. McCarthy | MIN | 10 | 291 | 23.5 | 125.4 | 31.52 |
Relying solely on P2S would lead us to discard difference-makers like Drake Maye, whose rushing ability and high-level processing cushion the blow of high pressure rates. Success under pressure requires systemic infrastructure support: scheme, weapons, and processing speed. New England supplied Maye with those pillars, driving his QB2 campaign and 90.2 passer rating under pressure.
The remaining QBs fell short. Geno Smith lacked overall infrastructure outside of Brock Bowers. Shough’s sample size makes his true baseline harder to project, and McCarthy lacked advanced processing speed despite otherwise solid supporting infrastructure. Examining pressure fantasy points makes the gap between Maye and the rest starkly apparent.
Analysis Pivot
P2S rates north of 20% demand a deeper look at pressure fantasy production. By breaking down pressure fantasy points (PrFPts) per game, we can isolate which QBs suffer from poor blocking and which ones insulate themselves through elite play.
“But wait! We established that pressures are way less correlated with fantasy production than sacks, right?”
Yes, we did, but we also know sacks are drive-killers, which fails to tell us what happens when they avoid the sack. The 20+% P2S rate helps focus our analysis on those teams that enable opposing DLs to be productive. Defenses that see a high P2S are licking their chops and thus are more likely to ramp up pressure to increase sack opportunities. Therefore, we pivot to evaluate these QBs’ production while under pressure to reveal a more actionable perspective.
| Player | Team | Games | Att | Pressures | P2S% | QBR | PrFPts | PrFPts/G |
| Tua Tagovailoa | MIA | 14 | 440 | 131 | 22.90% | 65.7 | 47 | 3.36 |
| Justin Fields | NYJ | 9 | 260 | 116 | 23.30% | 95.3 | 39.8 | 4.42 |
| Lamar Jackson | BLT | 13 | 368 | 156 | 22.40% | 84.2 | 52.4 | 4.03 |
| Drake Maye | NE | 21 | 755 | 284 | 23.90% | 90.2 | 91.2 | 4.34 |
| Justin Herbert | LAC | 17 | 660 | 288 | 20.80% | 74.2 | 91.4 | 5.37 |
| Jaxson Dart | NYG | 13 | 414 | 152 | 22.40% | 76.5 | 47.3 | 3.64 |
| Aaron Rodgers | PIT | 17 | 579 | 154 | 21.40% | 67.5 | 46.9 | 2.76 |
| J.J. McCarthy | MIN | 10 | 291 | 115 | 23.50% | 66.4 | 31.5 | 3.15 |
| Tyler Shough | NO | 11 | 378 | 124 | 25.00% | 72.4 | 31.9 | 2.9 |
| Geno Smith | LV | 15 | 524 | 212 | 25.90% | 53.9 | 50.1 | 3.34 |
| Cam Ward | TEN | 17 | 623 | 230 | 23.50% | 55.9 | 48.8 | 2.87 |
While Maye, Herbert, and Jackson clear the 20% P2S warning line, their baseline talent overrides the structural concern. Using 4+ pressure fantasy points per game as the benchmark for relative fantasy immunity to pressure, Herbert, Jackson, and Maye remain every-week locks. Shough had a lowly 2.9 PrFPts per game, but his tape keeps me interested in him for 2026. An absolute floor of 3.5 PrFPts per game appears to warrant cautious trust, and Dart could fall in this category with the reinforcements of Malik Nabers and Cam Skattebo.
The Beneficiaries
Identifying suspect offensive lines and evaluating the QB under pressure brings us to the next layer: who actually benefits in target volume when pressure spikes? This often comes down to play-caller adaptability versus stubborn adherence to a game plan.
To evaluate this, we examine two contrasting 2025 situations: Geno Smith and Drake Maye. By pulling weekly PFF passing stats, inferring pressures via P2S rates, and establishing baseline team pressure averages, we can map out target differentials between clean pockets and high-pressure environments.

Nathan Ray Seebeck-Imagn Images
Case Study 1: Las Vegas Raiders
Geno’s season was rocky, but the data highlights clear target reallocation under duress. The primary beneficiaries were the team’s top route-running WR, Jakobi Meyers, and Ashton Jeanty out of the backfield on checkdowns. This shows a clear effort by the passer or the OC to pivot by increasing layup throws:
| Team | Player | Position | Below Avg Tgts | Above Avg Tgts | Tgt Diff |
| LV | Jakobi Meyers | WR | 5.67 | 7.75 | 2.08 |
| LV | Ashton Jeanty | RB | 3.00 | 4.82 | 1.82 |
| LV | Tre Tucker | WR | 4.80 | 5.58 | 0.78 |
| LV | Dont’e Thornton Jr. | WR | 2.29 | 3.00 | 0.71 |
| LV | Raheem Mostert | RB | 1.00 | 1.50 | 0.50 |
| LV | Jack Bech | WR | 2.50 | 2.67 | 0.17 |
| LV | Brock Bowers | TE | 6.50 | 6.40 | -0.10 |
| LV | Michael Mayer | TE | 4.75 | 4.00 | -0.75 |
| LV | Tyler Lockett | WR | 4.00 | 3.25 | -0.75 |
All well-known skill players were included in this table so you could see how they were impacted. This angle of the data supplies us with pivot points, but it also highlights players, like Brock Bowers (-0.1 target differential), with extreme stability, independent of pressure.
Joseph Maiorana-Imagn Images
Case Study 2: New England Patriots
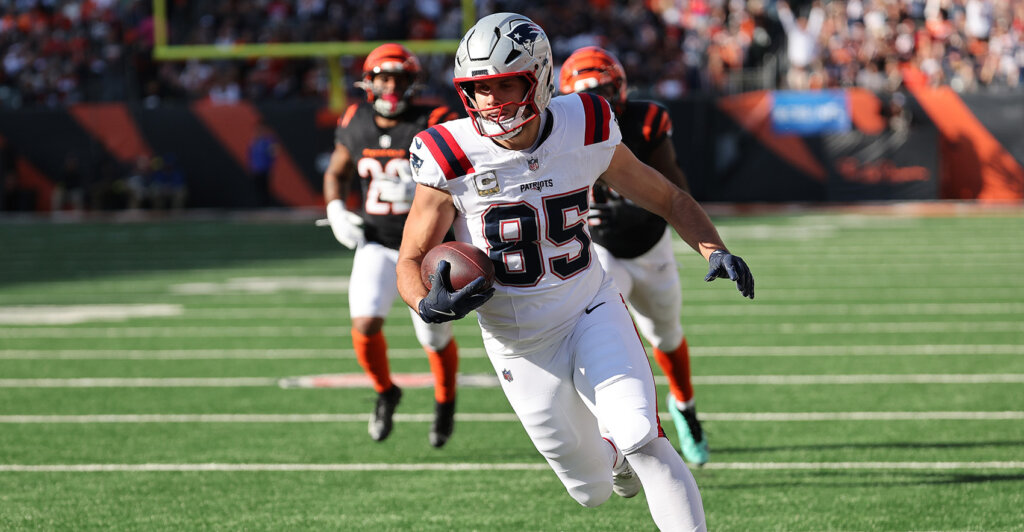
Conversely, the pressure impact on Drake Maye and the Patriots was remarkably stable. TEs and TreVeyon Henderson saw roughly one extra target per game under higher pressure, while lower-pressure scripts slightly favored downfield options like Kyle Williams. Overall, this minimal shift underscores the profile of an elite, high-level processing QB who maintains structural distribution under duress.
| Team | Player | Position | Below Avg Tgts | Above Avg Tgts | Tgt Diff |
| NE | Hunter Henry | TE | 4.18 | 5.10 | 0.92 |
| NE | TreVeyon Henderson | RB | 2.67 | 3.38 | 0.71 |
| NE | Austin Hooper | TE | 1.60 | 2.29 | 0.69 |
| NE | Mack Hollins | WR | 3.86 | 4.44 | 0.59 |
| NE | Demario Douglas | WR | 2.56 | 3.11 | 0.56 |
| NE | Rhamondre Stevenson | RB | 2.33 | 2.89 | 0.56 |
| NE | Stefon Diggs | WR | 5.73 | 6.00 | 0.27 |
| NE | Drake Maye | QB | 0.00 | 1.00 | 0.00 |
| NE | Efton Chism III | WR | 1.50 | 0.00 | 0.00 |
| NE | Kayshon Boutte | WR | 3.29 | 3.20 | -0.09 |
| NE | Kyle Williams | WR | 2.71 | 1.33 | -1.38 |
A Wider Look
Expanding our scope to the entire NFL reveals how individual target shares swing when certain offensive lines break down:
| Team | Player | Position | Below Avg | Above Avg | Diff |
| HST | Nico Collins | WR | 5.20 | 8.83 | 3.63 |
| SF | Ricky Pearsall | WR | 4.43 | 8.00 | 3.57 |
| TB | Jalen McMillan | WR | 2.00 | 5.50 | 3.50 |
| WAS | Zach Ertz | TE | 3.20 | 6.50 | 3.30 |
| DAL | CeeDee Lamb | WR | 7.20 | 10.00 | 2.80 |
| NYG | Malik Nabers | WR | 5.67 | 8.00 | 2.33 |
| WAS | Terry McLaurin | WR | 4.71 | 7.00 | 2.29 |
| DET | Jahmyr Gibbs | RB | 4.00 | 6.20 | 2.20 |
| HST | Dalton Schultz | TE | 4.75 | 6.83 | 2.08 |
| JAX | Travis Hunter | WR | 5.25 | 7.33 | 2.08 |
| PHI | DeVonta Smith | WR | 5.44 | 7.22 | 1.78 |
| CHI | Colston Loveland | TE | 5.77 | 4.00 | -1.77 |
| LAC | Ladd McConkey | WR | 6.92 | 5.00 | -1.92 |
| JAX | Jakobi Meyers | WR | 7.43 | 5.50 | -1.93 |
| MIN | Justin Jefferson | WR | 9.60 | 7.58 | -2.02 |
| KC | Marquise Brown | WR | 5.56 | 3.44 | -2.11 |
| KC | Tyquan Thornton | WR | 4.00 | 1.75 | -2.25 |
| NYG | Wan’Dale Robinson | WR | 8.88 | 6.60 | -2.28 |
These extremes expose distinct tactical responses to pressure:
-
Jakobi Meyers (JAX): Appears here after changing teams, hinting at a distinct situational role post-trade.
-
Nico Collins: Spikes in targets when C.J. Stroud faces pressure – a great sign if pass protection remains shaky in 2026.
-
Terry McLaurin & Zach Ertz: Served as Jayden Daniels‘ trusted safety valves under duress; this makes me curious if Chig Okonkwo can become a valuable move TE in Washington.
-
Malik Nabers vs. Wan’Dale Robinson: While logic suggests Wan’Dale would thrive in quick-pressure scenarios, Nabers dominated high-pressure targets while Wan’Dale thrived in clean pockets (though limited playing time overlap suggests some sample noise).
- Ricky Pearsall: Pearsall (3.5 target differential) is on IR (making me extremely sad), but maybe this is indicative that De’Zhaun Stribling could get a target bump in elevated-pressure games in 2026.
There is plenty more to glean from looking at the data this way, but it simply brings us to the ultimate question…
Should OL Performance Impact Fantasy Decisions in the Passing Game?
If you are going to use it, here is a recap of the analysis we conducted on QBs:
- Filter the data by P2S rate of 20+%
- Assess Pressure Fantasy Points (PrFPts) per game to identify each QB’s fantasy production susceptibility (3.50 PrFPts/G is the absolute floor for immunity)
- Sanity-check the data with a quick watch of the passer under pressure
- Make your decision with confidence
Separately, we analyze RBs/WRs/TEs to see who benefits from production under pressure by:
- Assessing the average per-game pressures allowed by each team’s OL
- Examining the above/below average pressure splits for each skill-position player’s per-game targets
- Integrate the story of the data with knowledge of the scheme/film
- Continue to play stable productive players (like Bowers) and/or pivot to target upside (like Nico or Wan’Dale)
Translating offensive line metrics into fantasy success requires exhaustive research. I caution all to layer this analysis on top of good fantasy fundamentals. With a rock-solid process, you may not need analysis regarding pressures and P2S.
If you do see opportunities to use this, the payoff depends on your format. This is potentially a goldmine for DFS price-point-pivots, but harder to project for season-long leagues due to NFL parity. Still, mapping out pressure-heavy schedule stretches can help you build redraft boards and target dynasty buys. It provides a marginal edge over time – provided you use film study to confirm the story the numbers try to tell.