
How Much Should Offensive Line Quality Impact Your Fantasy RB Decision Making? (Fantasy Football)


RBs can often be victims of their offensive line. Poor blocking can leave backs fighting off defenders before they even reach the line of scrimmage, severely limiting their ability to generate yards and fantasy points. We saw this last season with Ashton Jeanty, who was hit behind the line of scrimmage on more than 25% of his carries.
But should a shaky offensive line and the frequent stuffs that come with it actually be enough to scare fantasy managers away from an otherwise talented RB? In this article, we will dig into the numbers to find out just how much offensive line play matters for fantasy production.
The Metric: Stuff Rate
Before we dig in, a quick breakdown of the metric we are using. Stuff rate is the percentage of a team’s rushing attempts that are stopped at or behind the line of scrimmage (zero or negative yards gained). It is one of the cleanest team-level measures of run blocking because it isolates the line’s job before the ball carrier even has a chance to contribute.
Lower stuff rate = better run blocking. Higher stuff rate = more runs killed before they start.
Across our sample, the average NFL stuff rate from 2023–2025 was 17.2%.
Across 205 qualifying RB-seasons from 2023 to 2025, the correlation between team stuff rate and RB average PPR points per game is: r = -0.08 (p = 0.25)
This number is not significant. The relationship is in the right direction, showing that worse offensive lines are associated with slightly lower RB output, but the effect is small enough that it is statistically indistinguishable from noise.
The figure below shows every individual RB-season plotted against their team’s stuff rate.
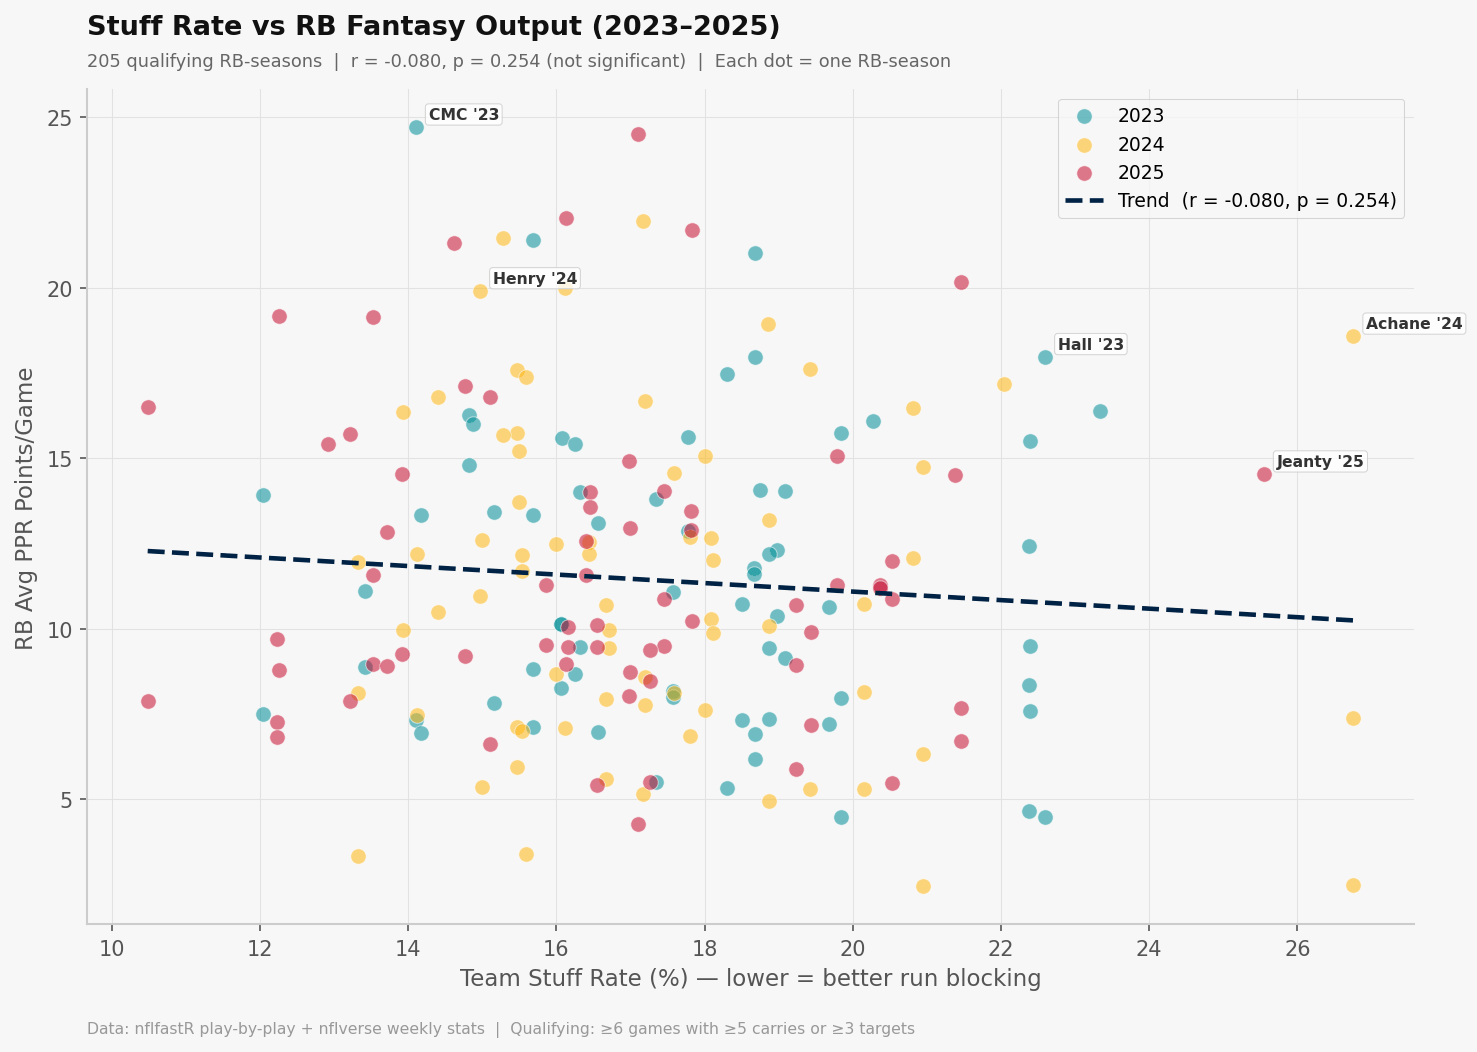
The cloud of dots tells the story. You see Christian McCaffrey putting up 24.7 PPR points per game on a San Francisco line with a 14.1% stuff rate in 2023. But you also see De’Von Achane averaging over 18 points per game on a Miami team with one of the worst stuff rates in the entire sample (26.8% in 2024). The scatter is real, and it runs in both directions.
The same result holds for consistency. The correlation between stuff rate and the percentage of weeks a back scored 10 or more PPR points is r = -0.09 (p = 0.19). Also not significant.
That said, there is a directional trend worth noting. When I split all 32 teams into five groups based on stuff rate, the top quintile (best offensive lines) outperformed the bottom quintile on every metric.
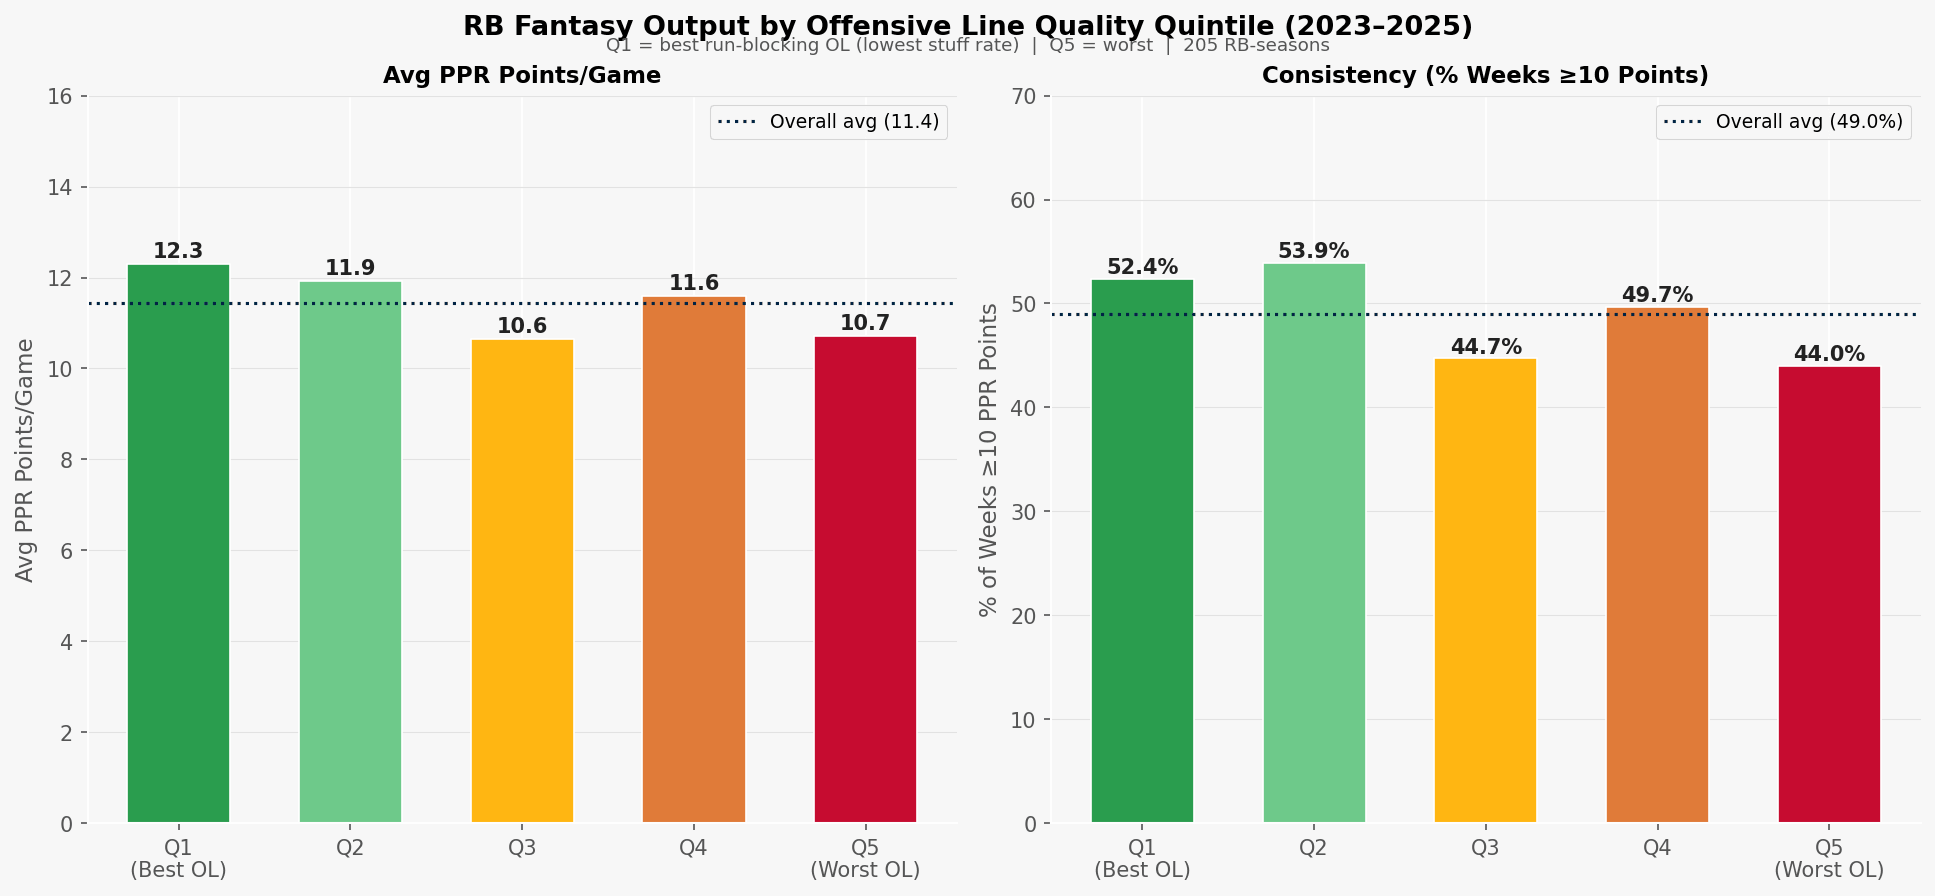
RBs behind the best offensive lines averaged about 1.6 more PPR points per game than RBs behind the worst. But it is also a difference of less than two points per week, which is not enough to dramatically change your draft board on its own.
Let’s look into why we aren’t seeing any correlation.
Individual talent overwhelms scheme. The players who dominate fantasy football are simply too good for the line to matter that much. De’Von Achane behind a terrible Miami offensive line was still a top-12 RB because his speed and elusiveness turned poor blocks into big plays. Saquon Barkley in 2023 averaged 16.1 PPG on a Giants line that had a 20.3% stuff rate. Breece Hall, same team and year, averaged 18.0. Great players find a way.
Stuff rate doesn’t capture everything. A line that consistently gets pushed back two yards but opens up cutback lanes is treated the same as one that just gets blown up. The metric captures extreme failures well but misses a lot of the nuance in between.
Coaching and scheme matter as much as personnel. A well-designed zone-blocking scheme can generate positive rushing results even with average linemen, while a power-blocking scheme with great linemen can produce poor stuff rates if the timing is wrong.
Is Stuff Rate Even Consistent Year to Year?
This matters a lot for using it in draft decisions. If stuff rate jumps around randomly from year to year, it is even less useful as a predictive tool.
The figure below shows year-over-year stability of team stuff rates.
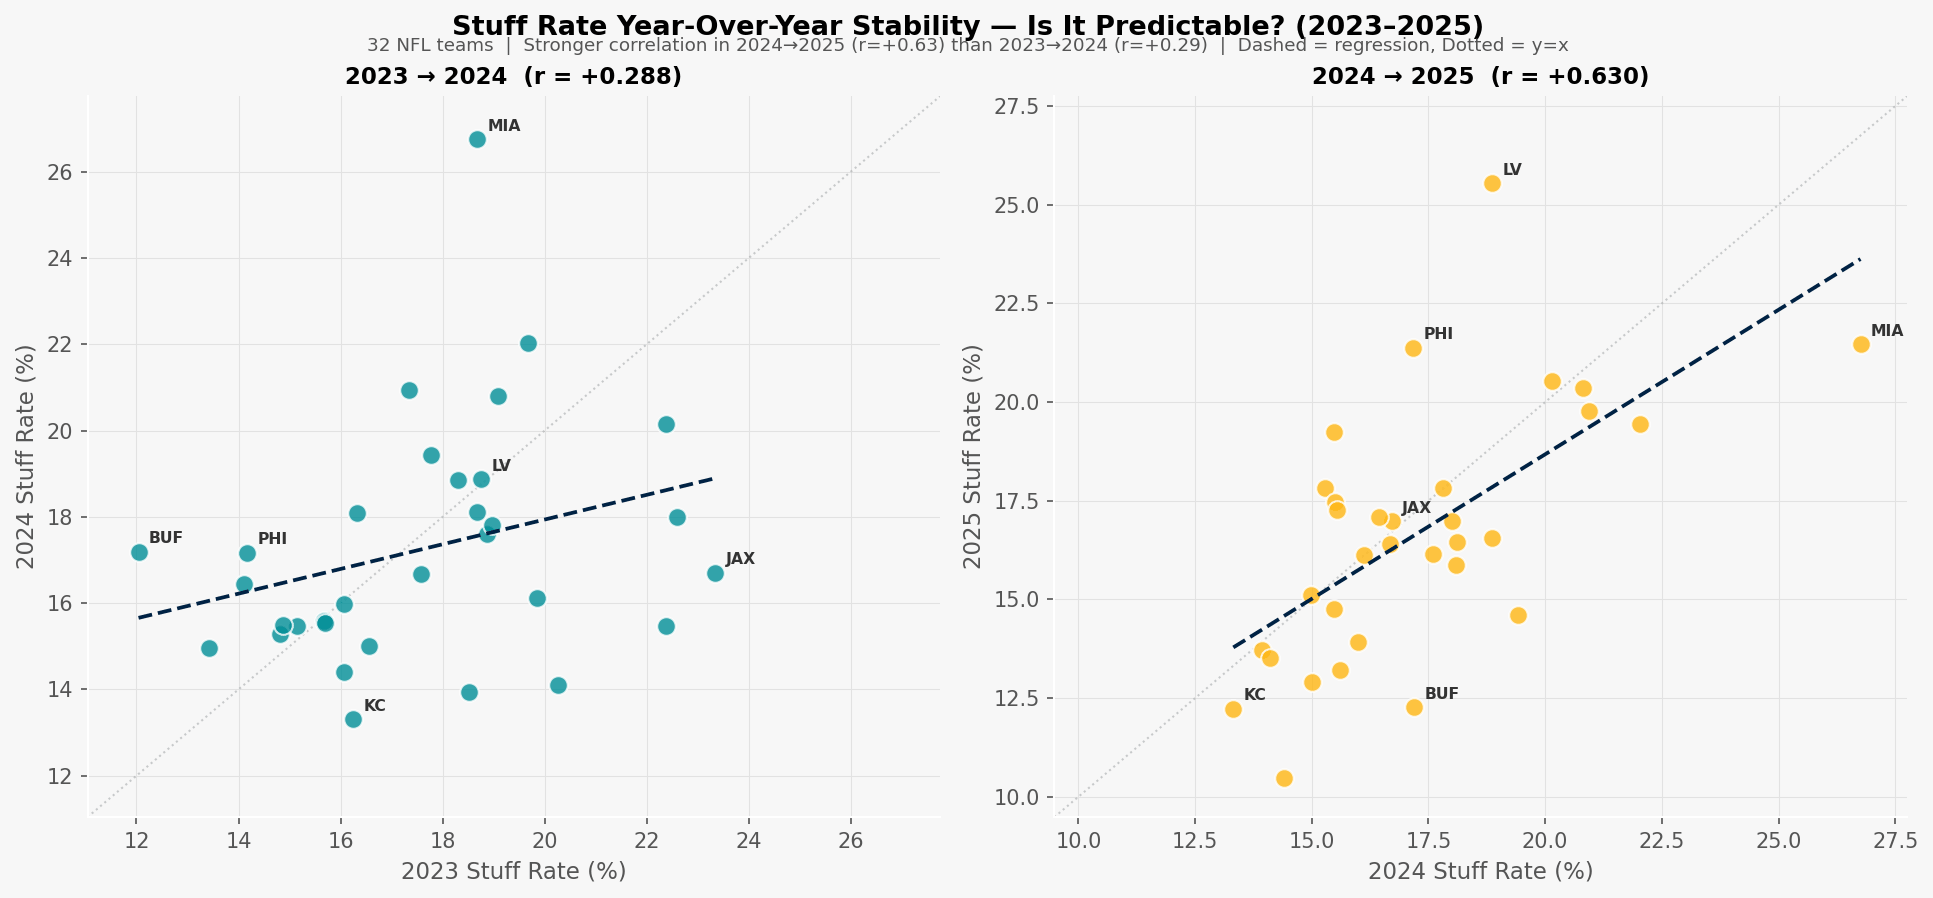
The 2024 to 2025 correlation is r = +0.63, which is fairly strong, showing about 40% of the variance in a team’s 2025 stuff rate is explained by their 2024 number. The 2023 to 2024 jump was weaker at r = +0.29, suggesting some meaningful volatility.
The takeaway: a team’s run-blocking identity tends to be somewhat persistent, but it is not destiny. Rosters change, coaches change, and a team that was in the bottom five one year can look completely different the next.