
NFL Team Performance Trends Week 10 (Fantasy Football)


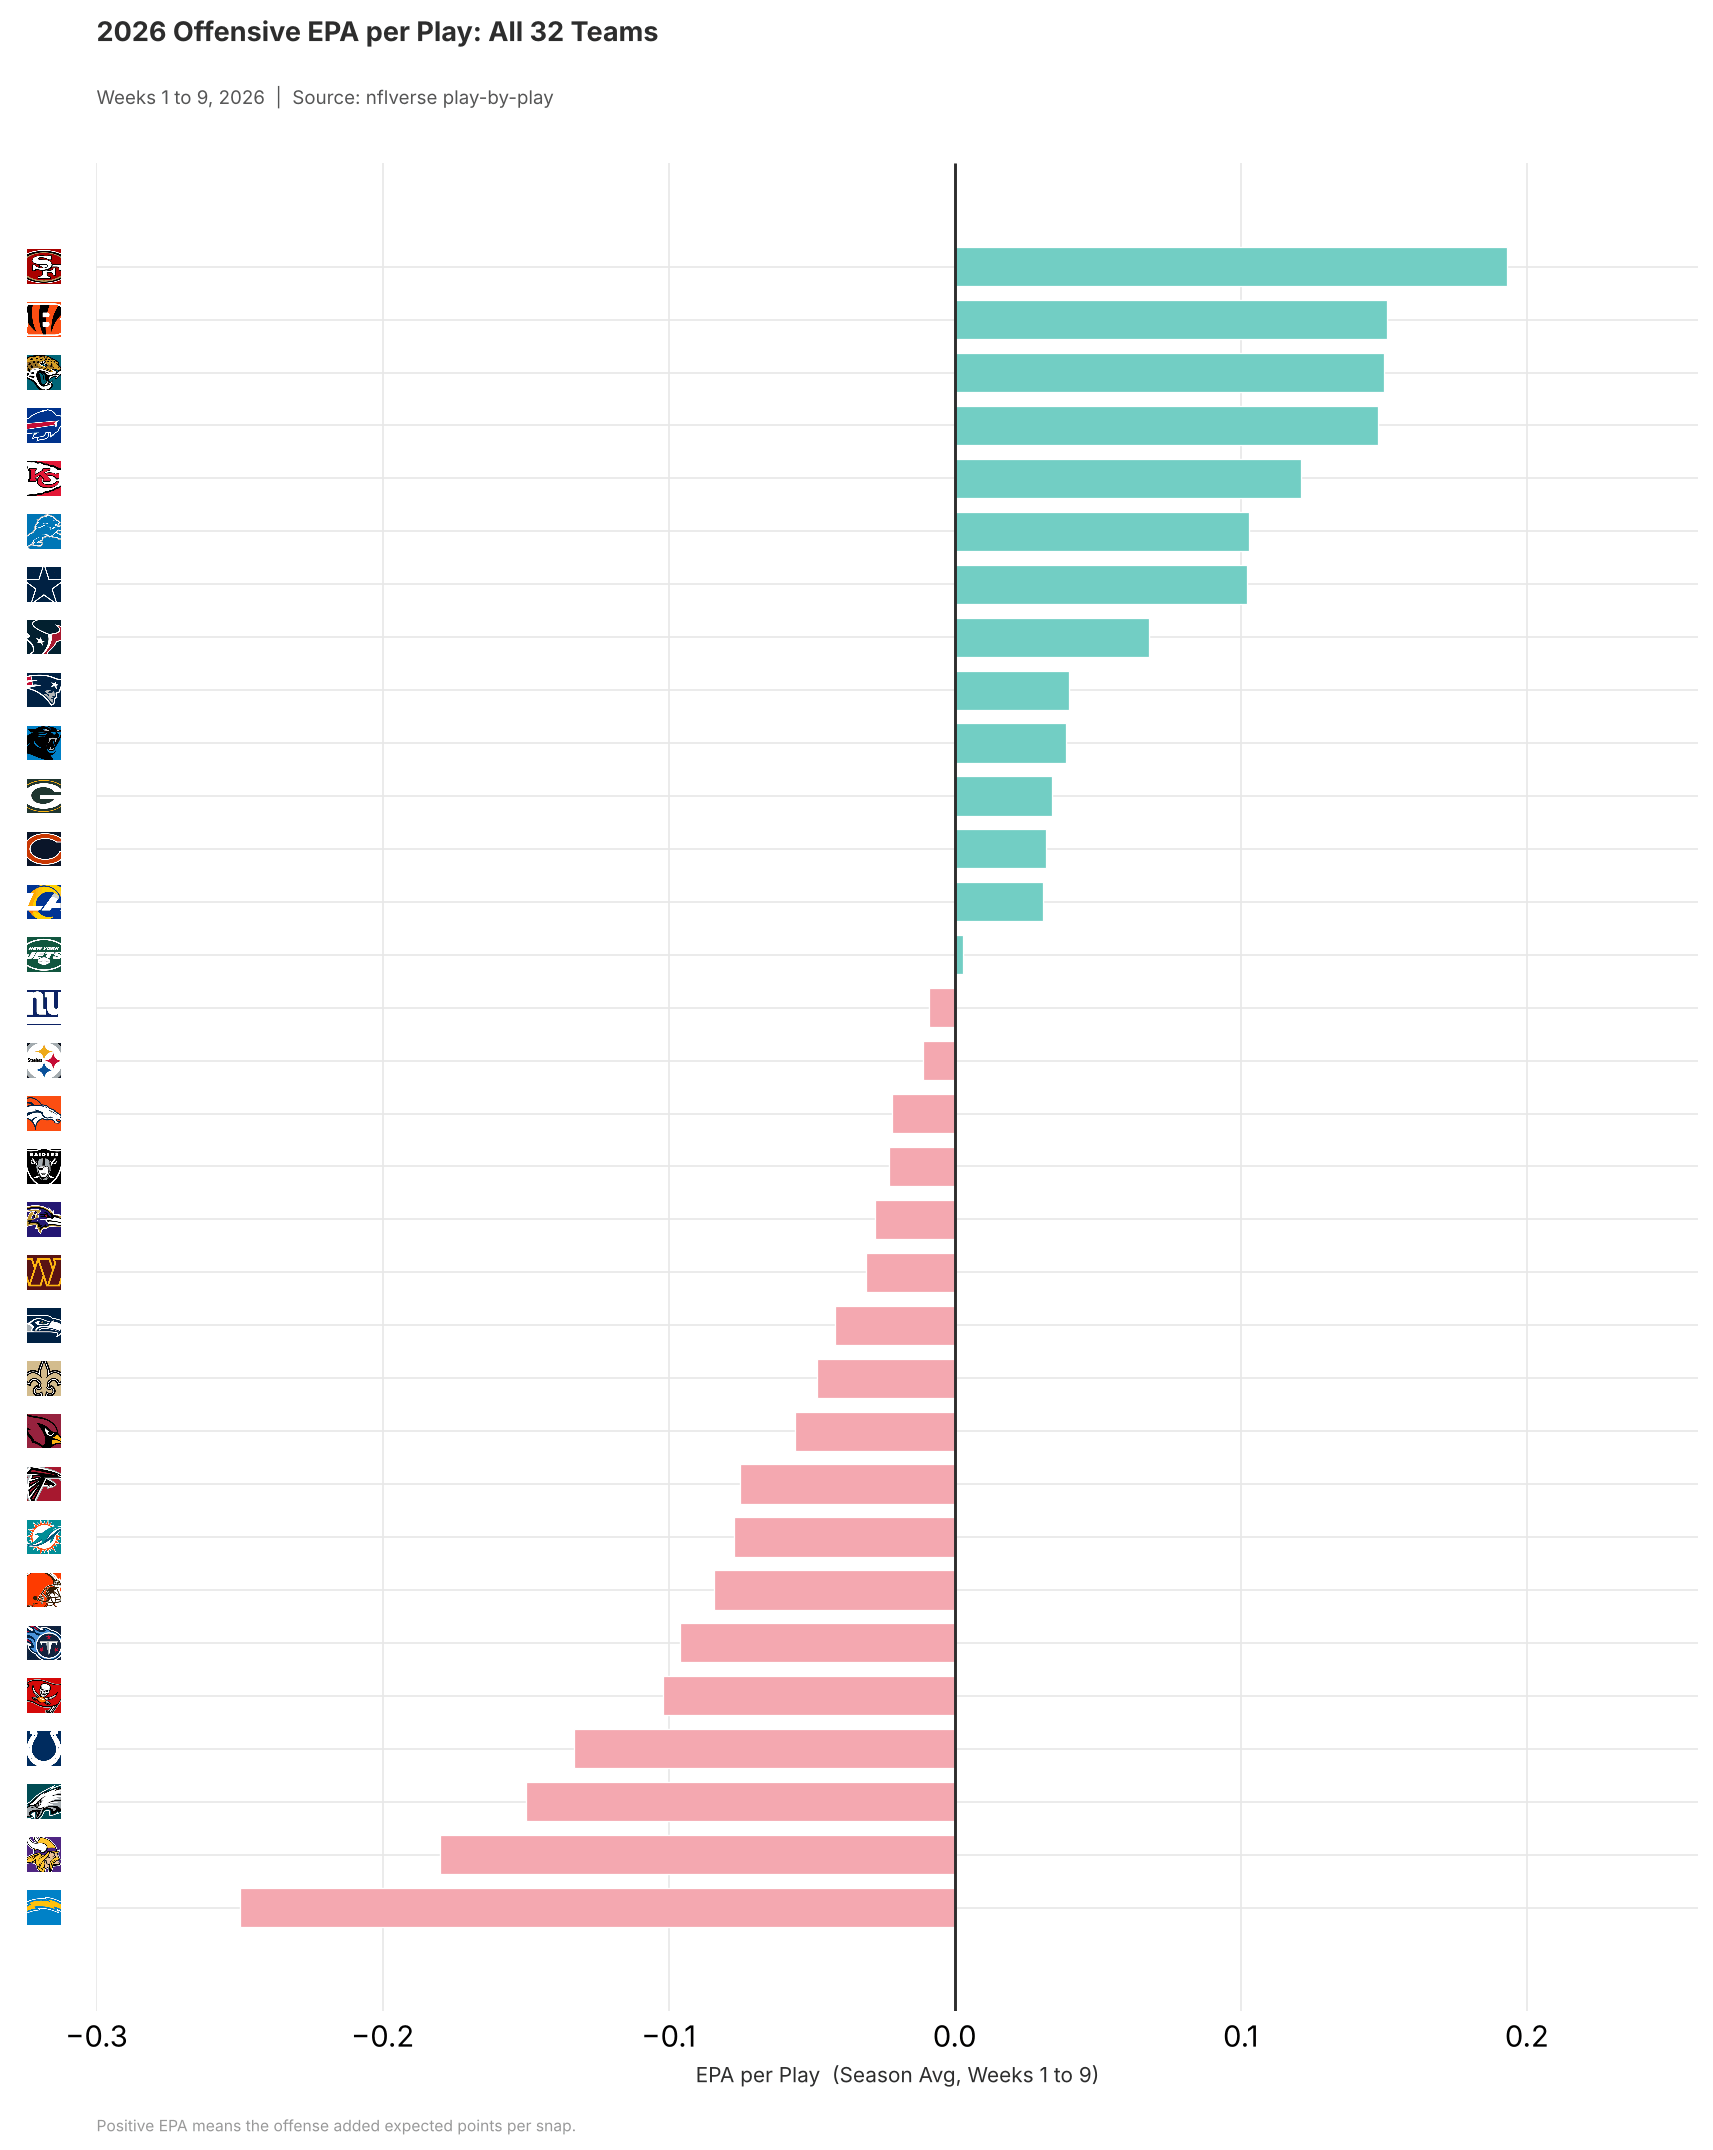
In this article, I will be diving into NFL team performance trends going into Week 10, using EPA per play on both sides of the ball. EPA measures how much a given play adds to or subtracts from a team’s expected points on that drive. For offenses, higher is better. For defenses, lower is better, since a negative number means the defense is taking expected points off the board.
Let’s get into it.
Offensive Takeaways
Cincinnati has been the best offense in football over the past five weeks at 0.24 EPA/play, nearly a tenth of a point clear of the next team. That is a different unit than the one that opened the year at roughly league average. They host Pittsburgh on Sunday night, which is the one thing working against them: the Steelers have one of the top defenses in the league, so this will be a good litmus test for the Bengals.
Houston at 0.14 EPA/play over five weeks is the quiet riser nobody is discussing. They travel to Cleveland, a defense that has been stout against the pass but has allowed 3.09 points per touch to TEs, the sixth most in that window. Watch out for Houston as they heat up.
Green Bay has climbed to 0.13 EPA/play in the last five weeks after opening the season at negative figures, the largest positive swing in the league. While they face Minnesota in Week 10, they are looking like a top offense in the league for the remainder of the season.
New England sits at 0.12 EPA/play over five weeks and plays Detroit in Munich. Despite Drake Maye‘s on-and-off struggles, the Patriots continue to put up positive offensive numbers.
Defensive Takeaways
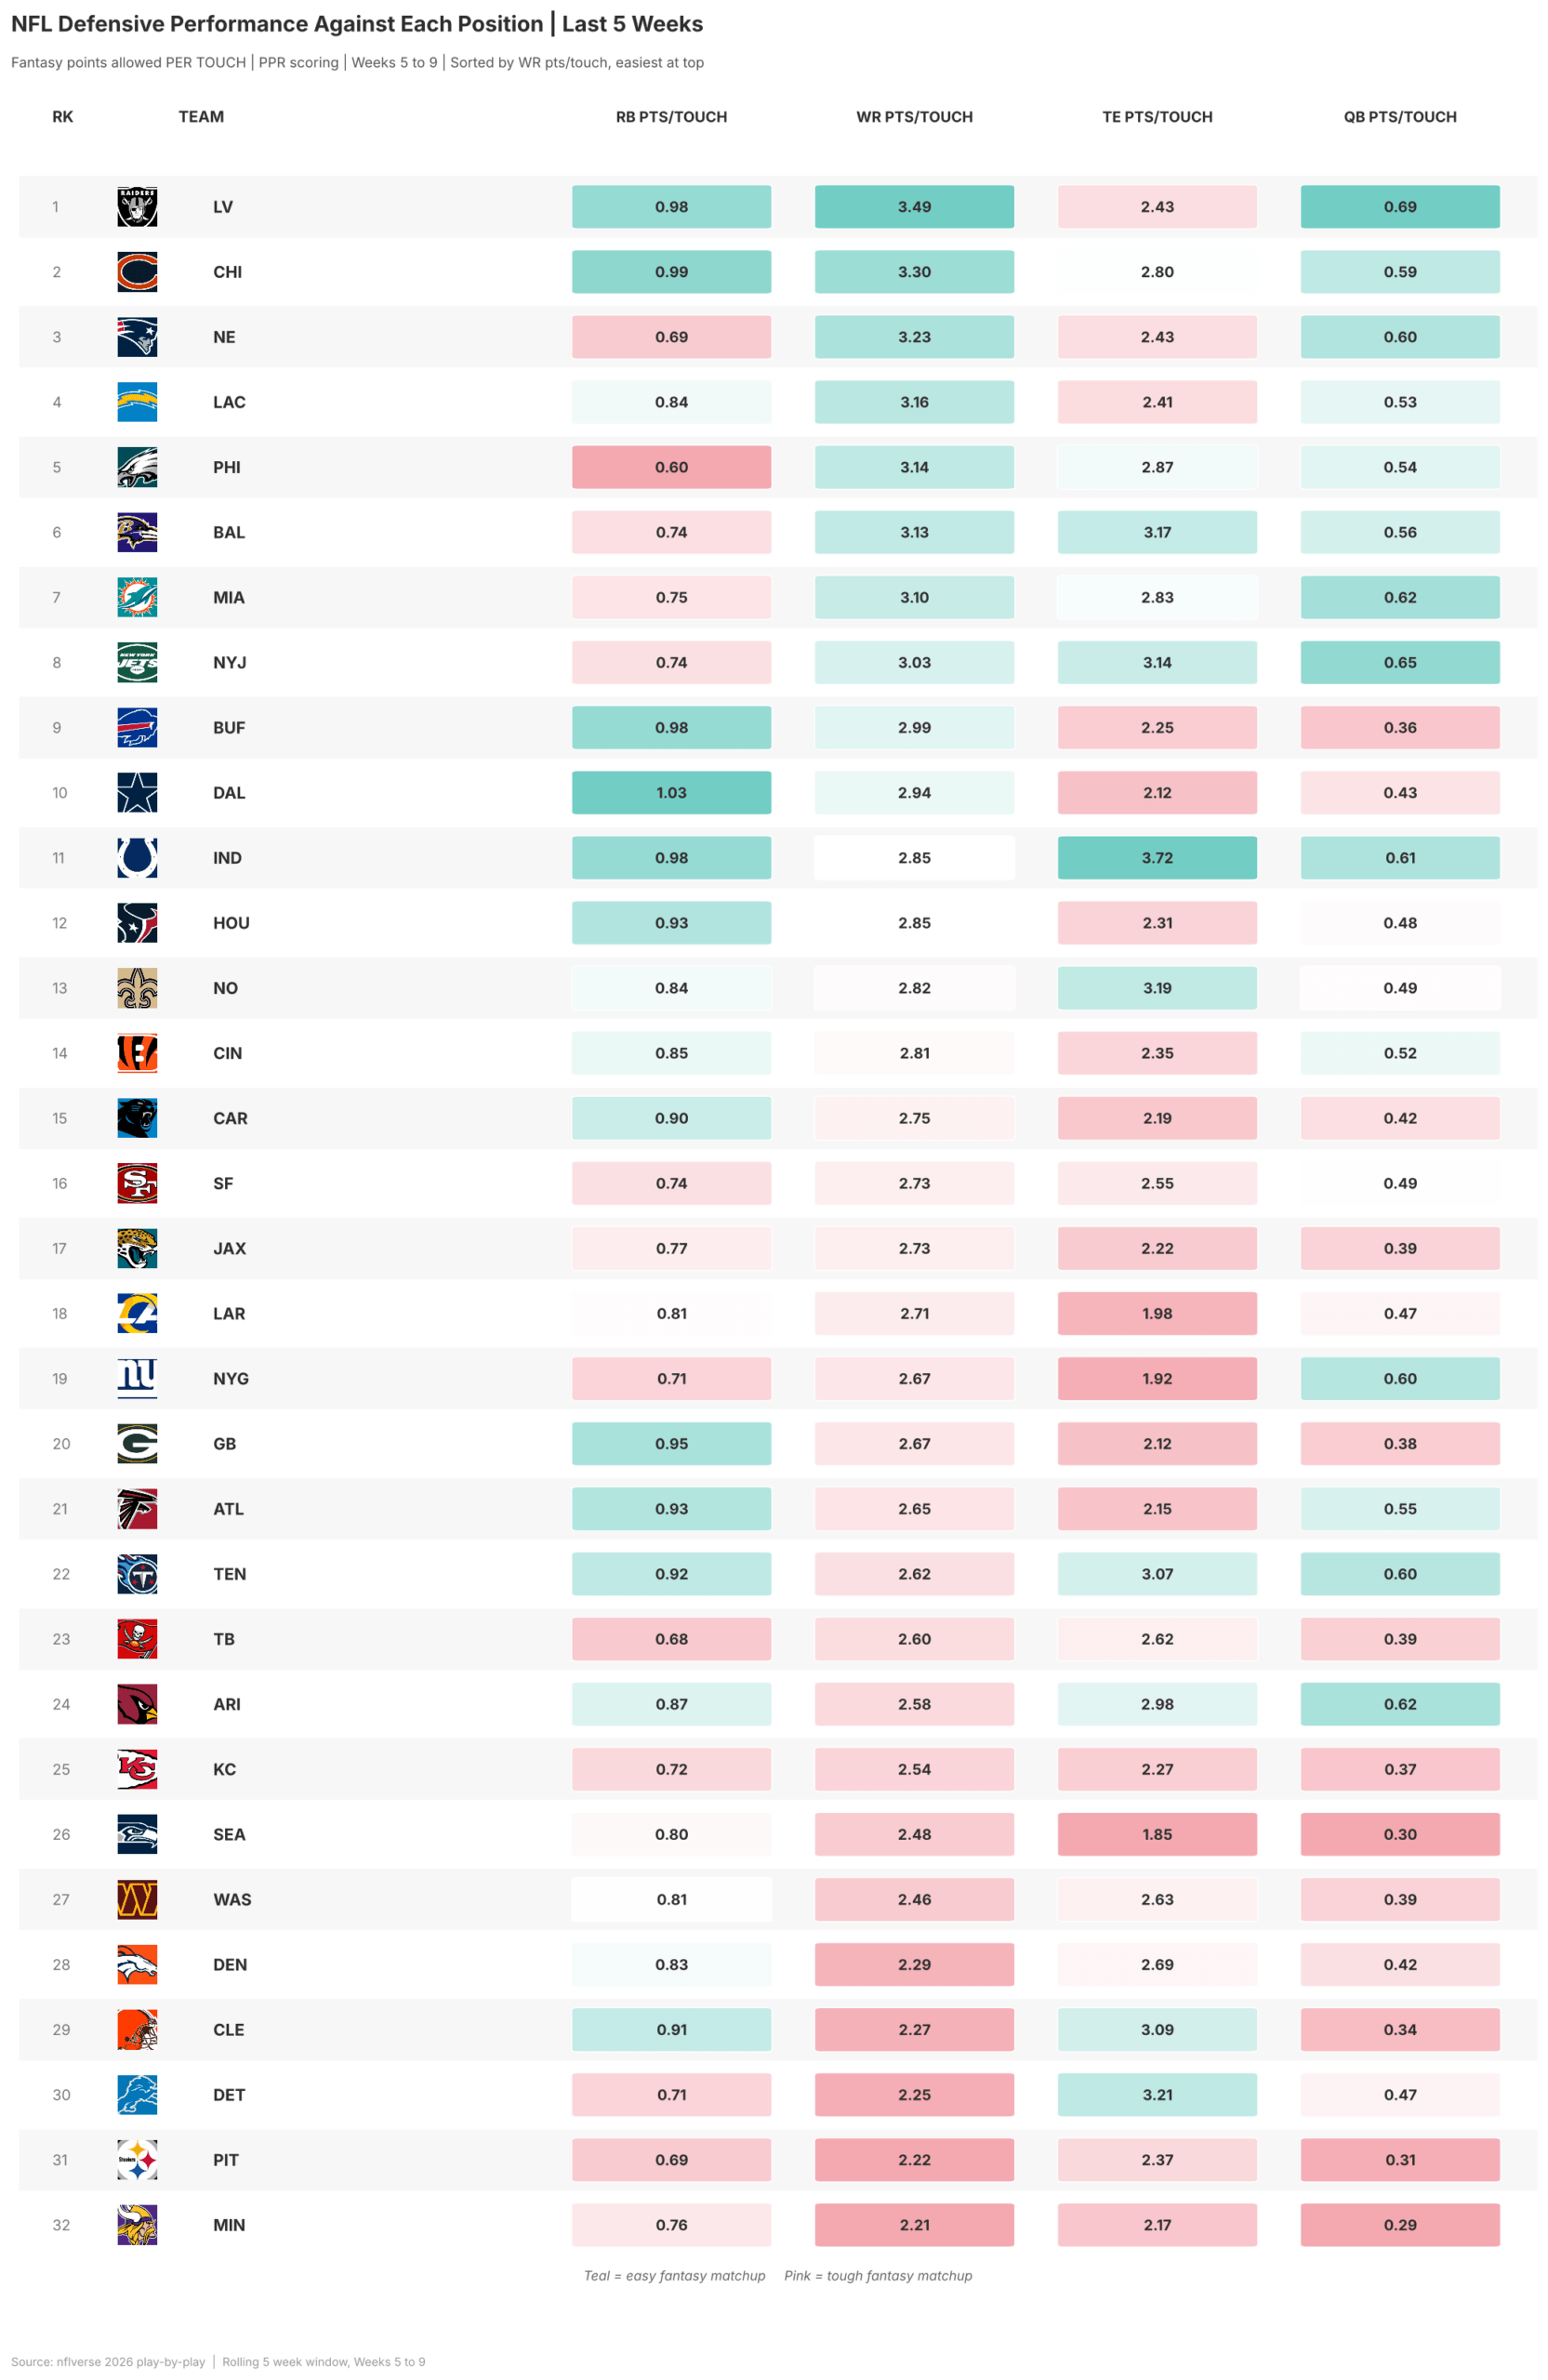
Las Vegas has been the worst defense in football over the past five weeks at -0.24 EPA/play, and the positional splits are brutal in every direction: 3.49 points per touch to WRs and 0.69 to QBs, both worst in the league, plus 0.98 to RBs, tied for third most. Everything Seattle does this week is in play.
Indianapolis has allowed 3.72 points per touch to TEs, more than half a point clear of the second-worst defense and the largest positional gap anywhere in this dataset. They have also been soft against the run at 0.98 per touch. Miami, at -0.14 EPA/play allowed, has given up 3.10 points per touch to WRs, the seventh most, and 0.62 to QBs, the third most, which makes the Colts and Dolphins game live in both directions despite two mediocre offenses.
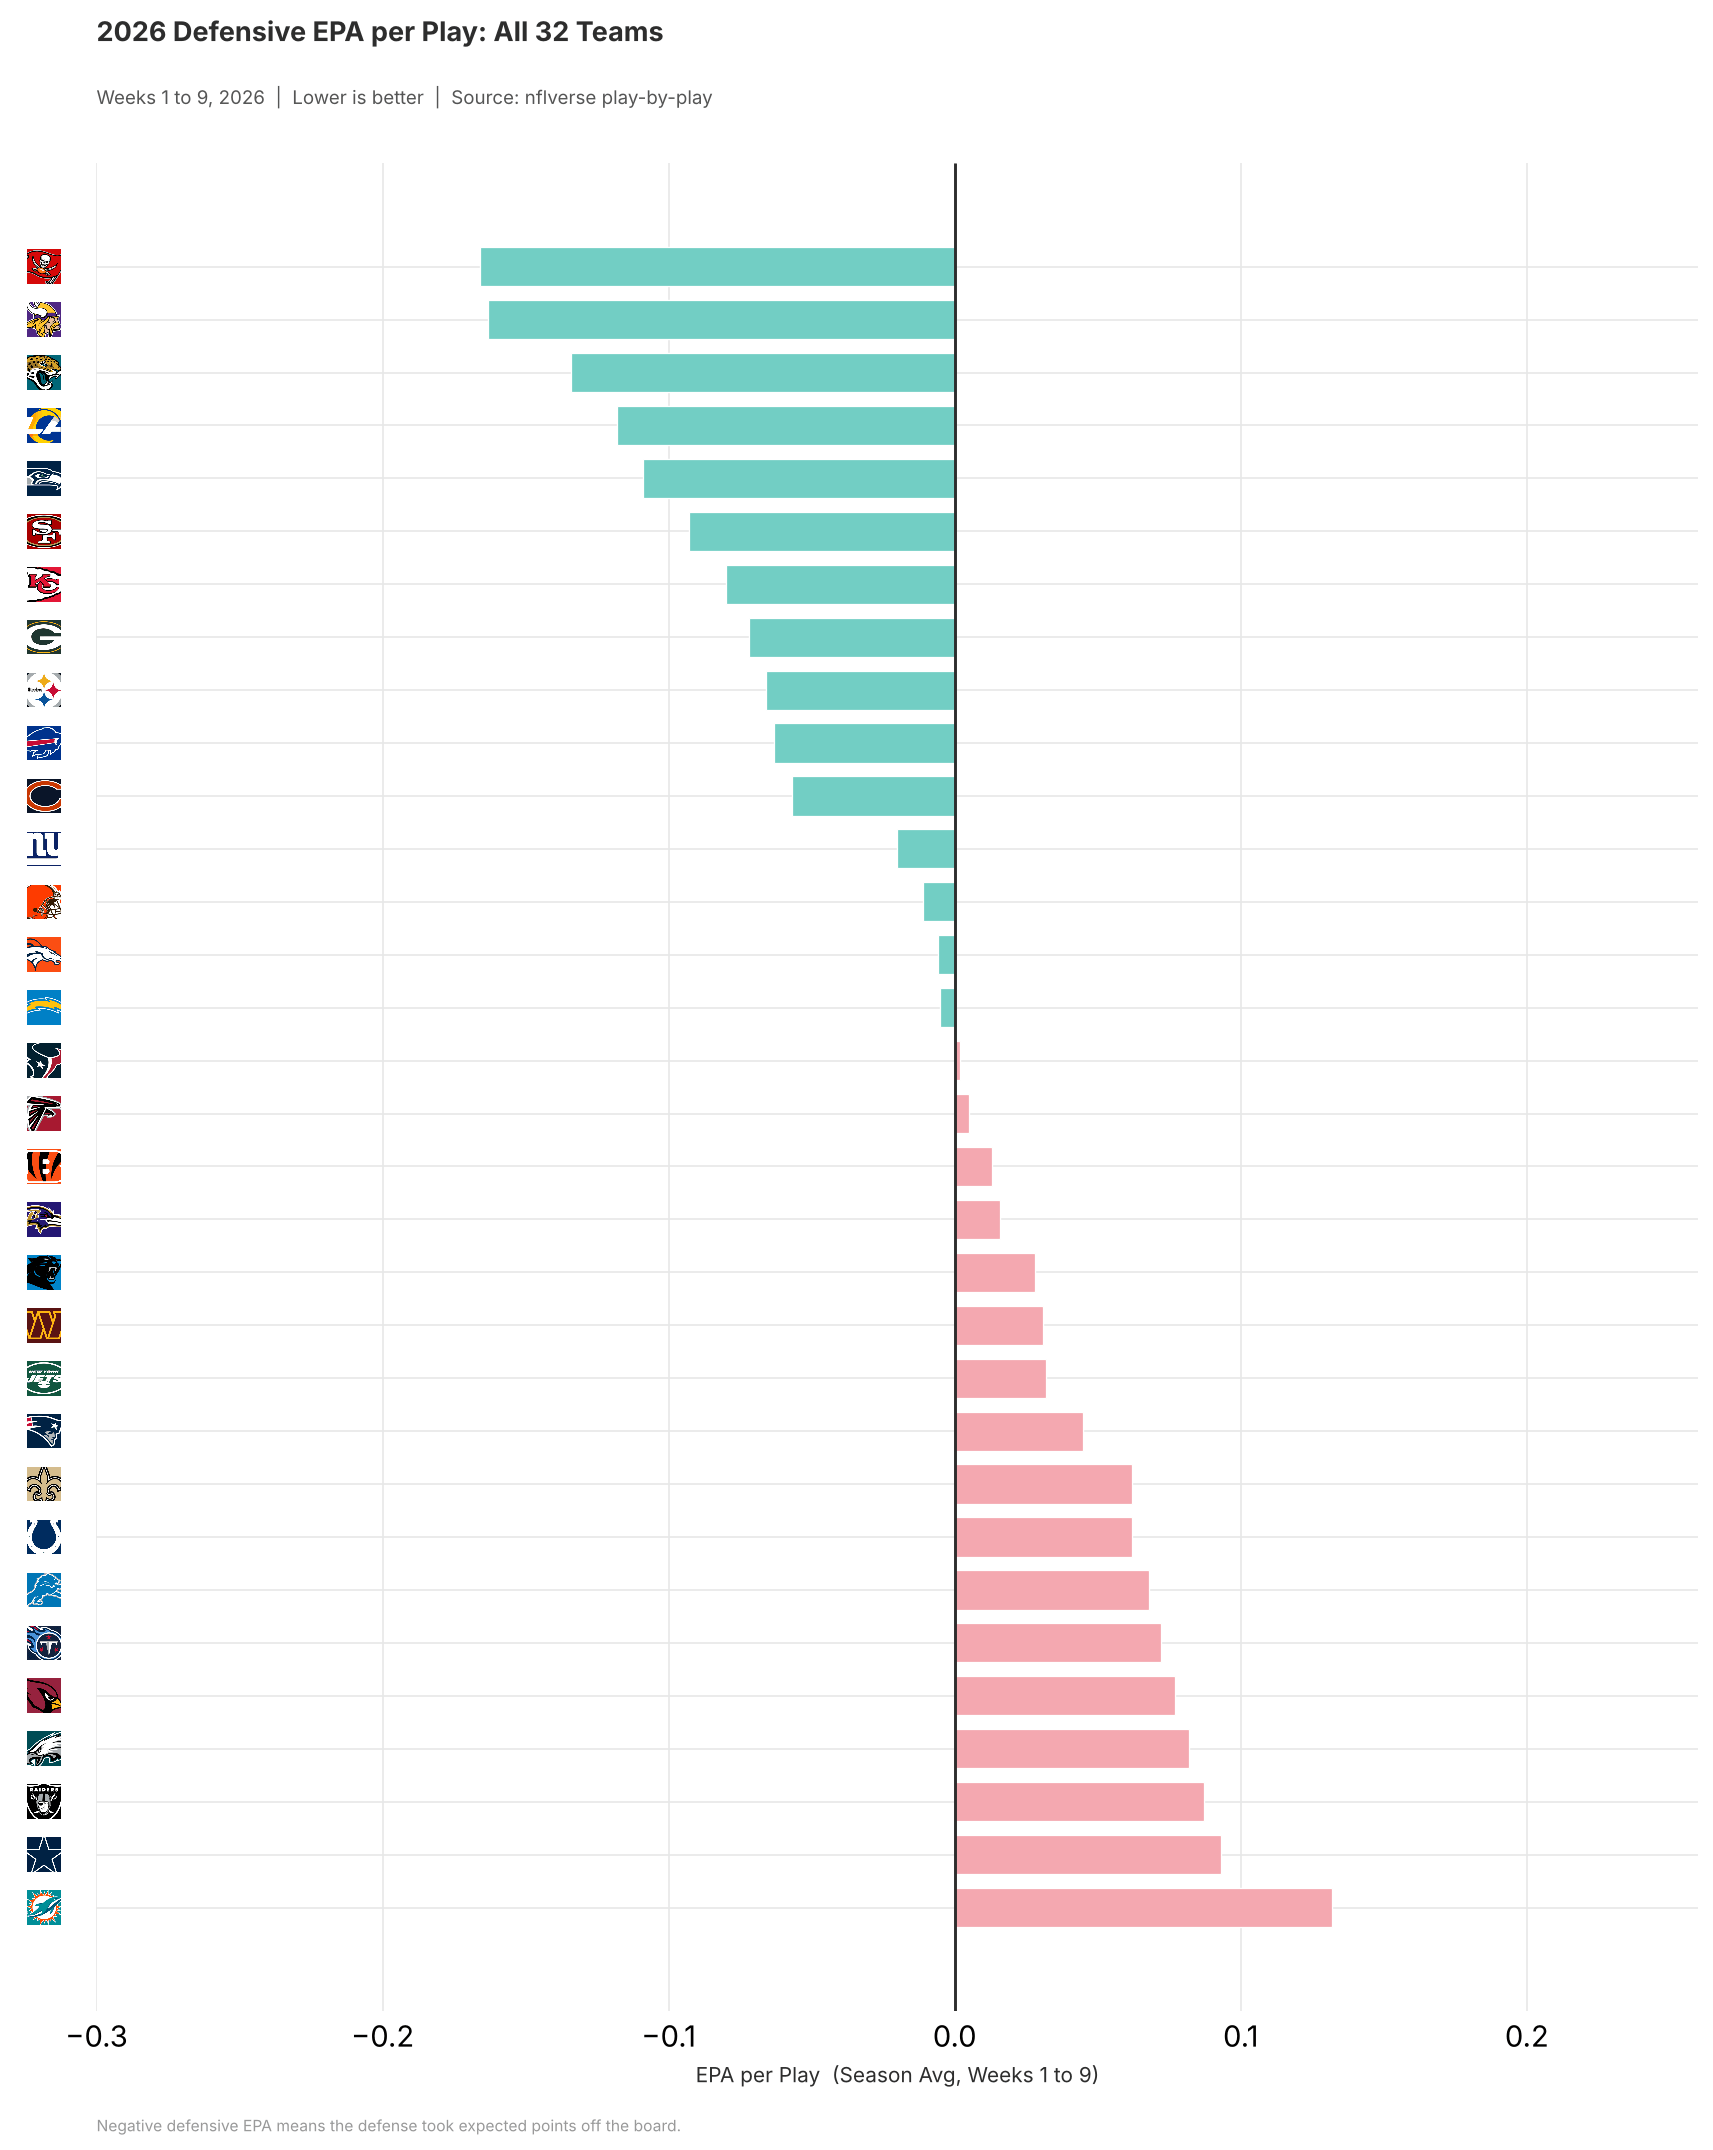
On the other side, Tampa Bay leads the league over five weeks at 0.25 EPA/play, with Buffalo at 0.23 and Jacksonville at 0.20 behind them. Minnesota has been the single toughest cover for receivers in football at 2.21 points per touch, and Pittsburgh is right behind at 2.22. Fade pass catchers in those games.

Player Spotlights
The following analysis highlights players who have strong breakout potential in Week 10, due to favorable matchups. Please see the table below to see the points allowed per touch for each position, for each defense in the league.
RBs: Ollie Gordon II draws Indianapolis at 0.98 points allowed per touch, tied for third most in the league, on 20.0 touches, and Quinshon Judkins gets Houston at 0.93, the seventh most in the league.
WRs: Zay Flowers gets the Chargers at 3.16, the fourth-most allowed in the league, and Keenan Allen draws Miami at 3.10, the seventh-most, on 5.4 touches as Indianapolis’ most-targeted receiver. Both are strong flex options for Week 10.
TEs: Greg Dulcich is the stream play of the week at the position. Indianapolis has allowed 3.72 points per touch to TEs against a 2.57 average, and Dulcich has grown into an every-down role at 3.8 touches a game. Dalton Kincaid faces the Jets at 3.14, the fifth most allowed in the NFL, also on 3.8 touches. Dalton Schultz gets Cleveland at 3.09, the sixth most, and Brenton Strange draws Tennessee at 3.07, the seventh most, on a group leading 4.0 touches.
QBs: Daniel Jones faces Miami at 0.62, the third most, on 37.4 dropbacks, and could have a strong performance in Week 10 if you need to stream a QB. Matthew Stafford draws Arizona at 0.62, the fourth most, and despite missing Puka Nacua, should have a strong performance in Week 10.
Team Trends
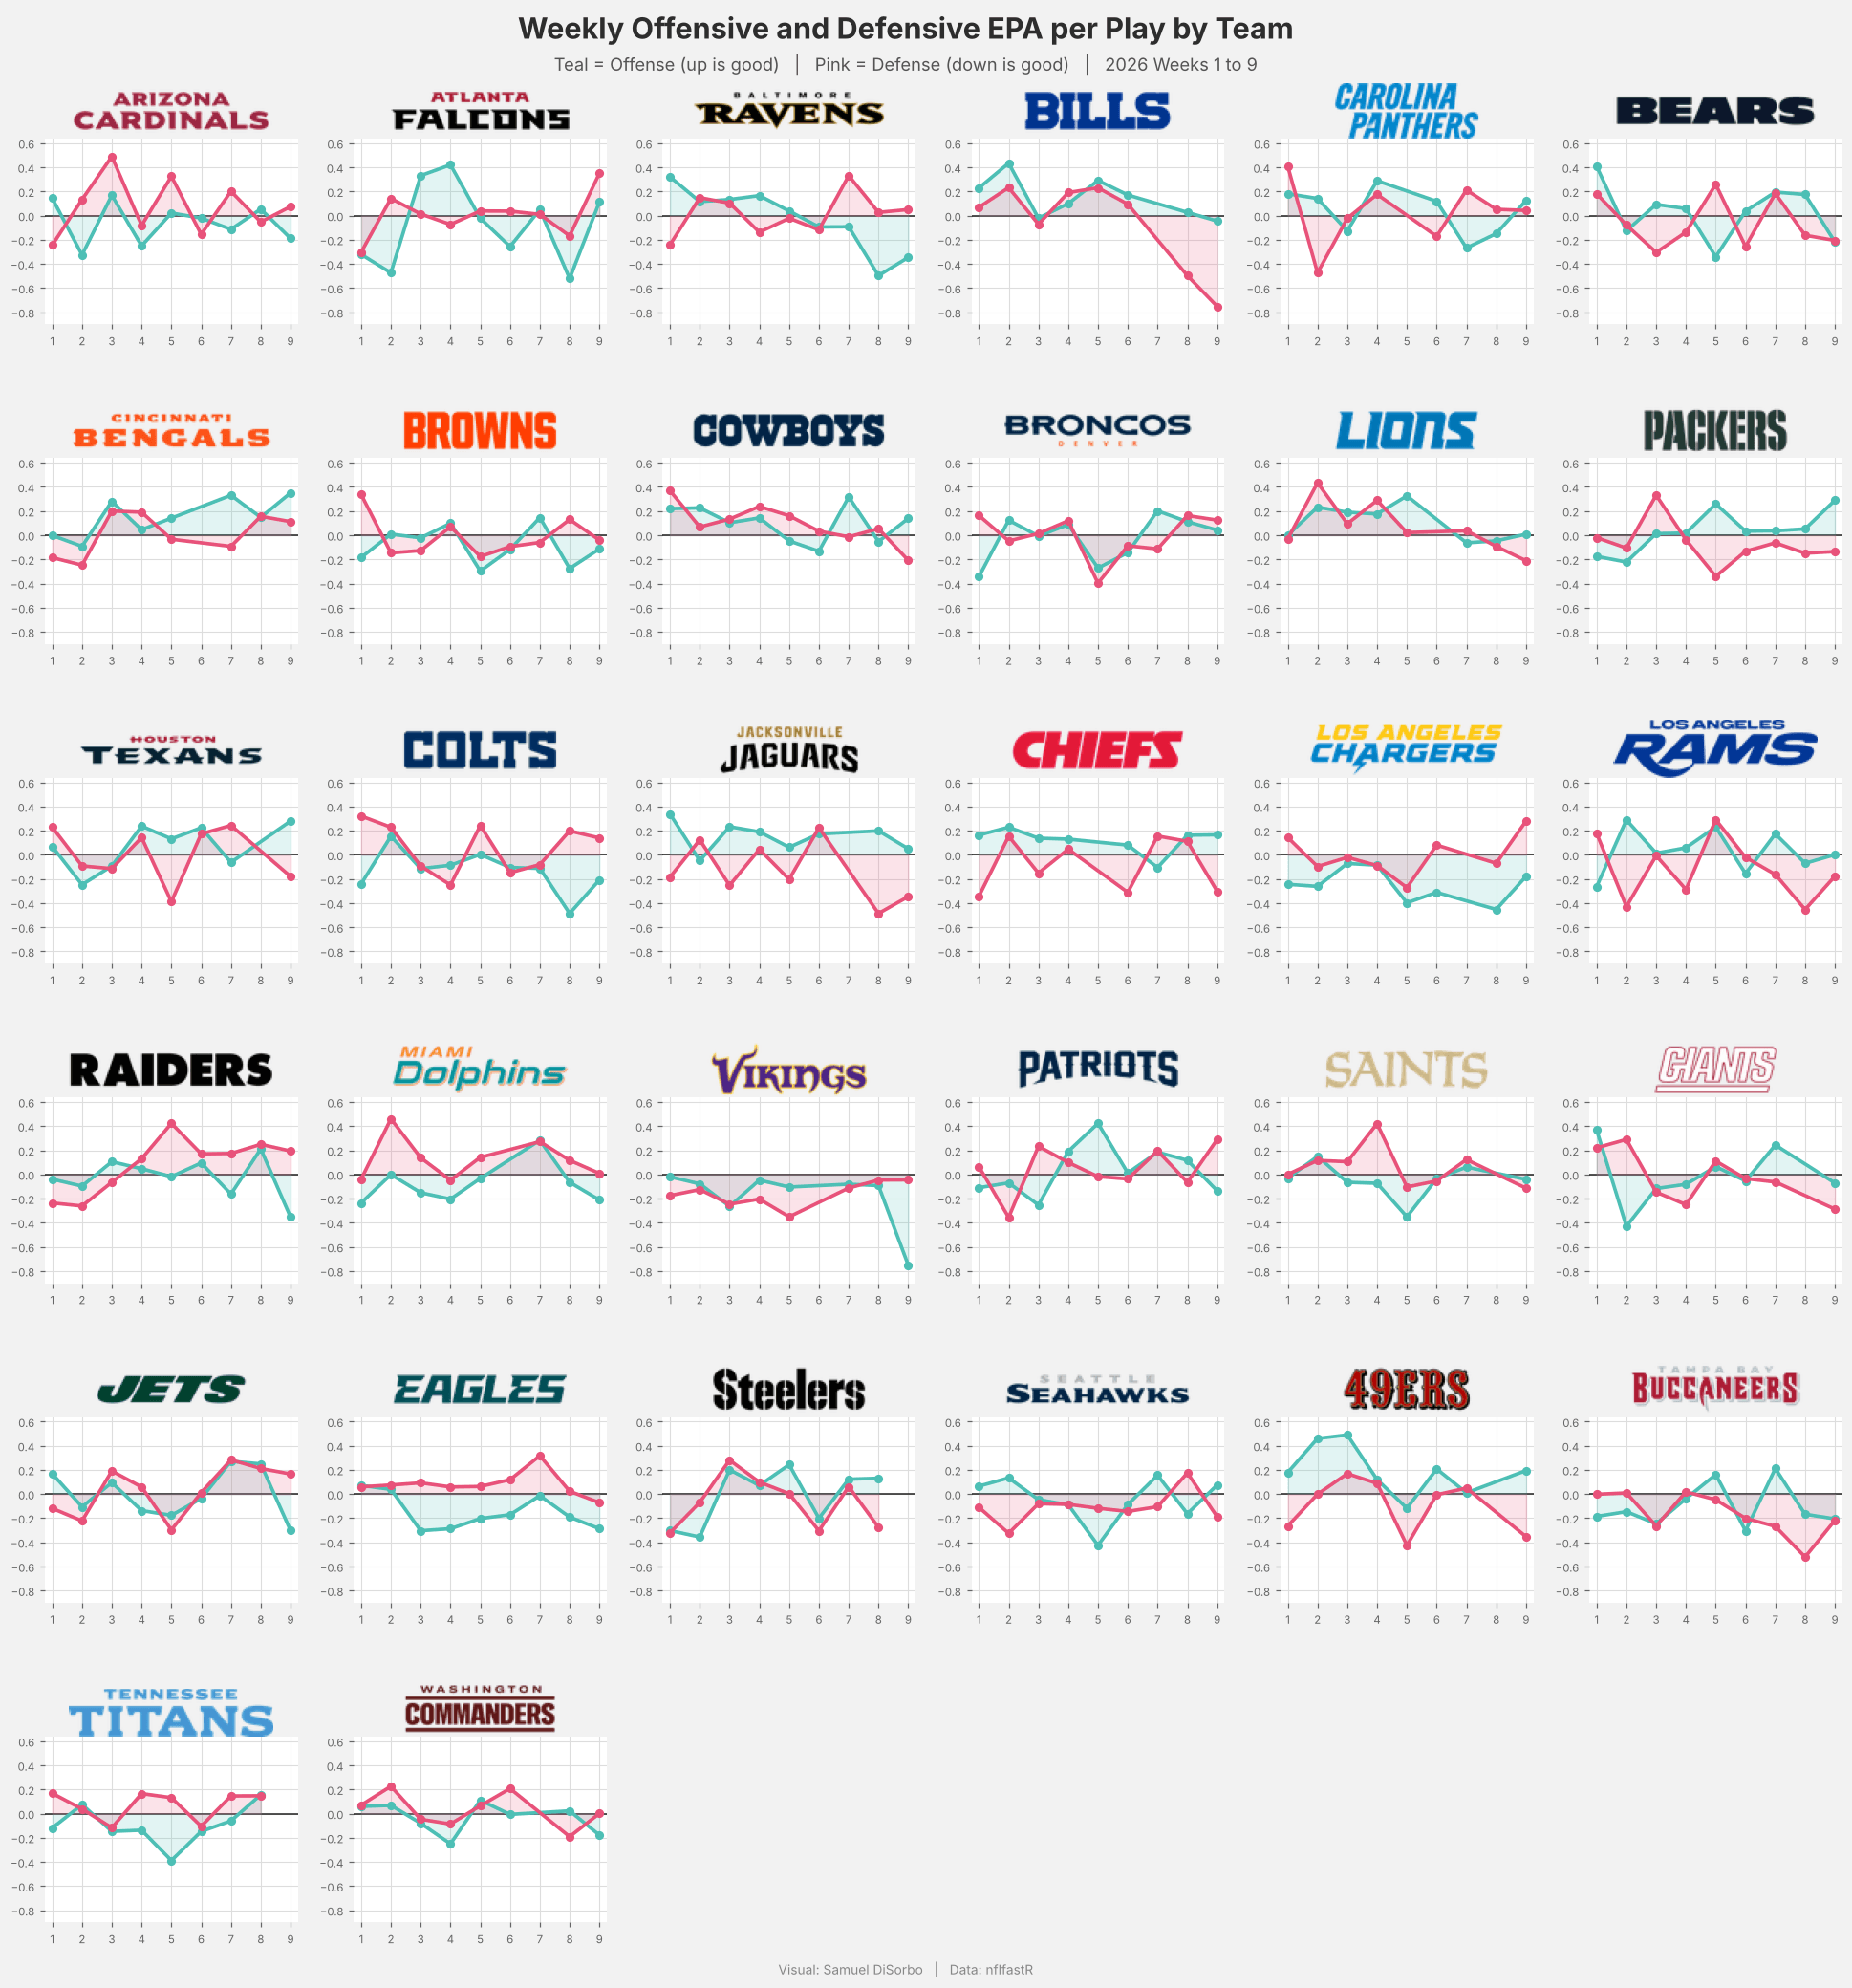
The trend line charts are where the season’s direction becomes legible, and a few movements stand out heading into Week 10.
San Francisco is a very interesting story offensively. They opened at 0.31 EPA/play over four weeks and have come down to 0.07 since. They still rank first in the league by season average, but that average is increasingly a description of September rather than of what they are now. Their defense has moved the opposite way, from roughly neutral to negative 0.18, so the profile has shifted from explosive to balanced.
Green Bay and Cincinnati are the two clearest risers. Green Bay has gone from negative 0.09 to positive 0.10 and Cincinnati from 0.06 to 0.24, the two largest positive offensive swings in the league. Houston, at negative 0.01 to 0.14, belongs in that group as well.
On defense, Buffalo has improved more than anyone, shedding thirty four hundredths off their early mark to arrive at 0.23 over the last four weeks.
See team EPA matchups for Week 10 below. 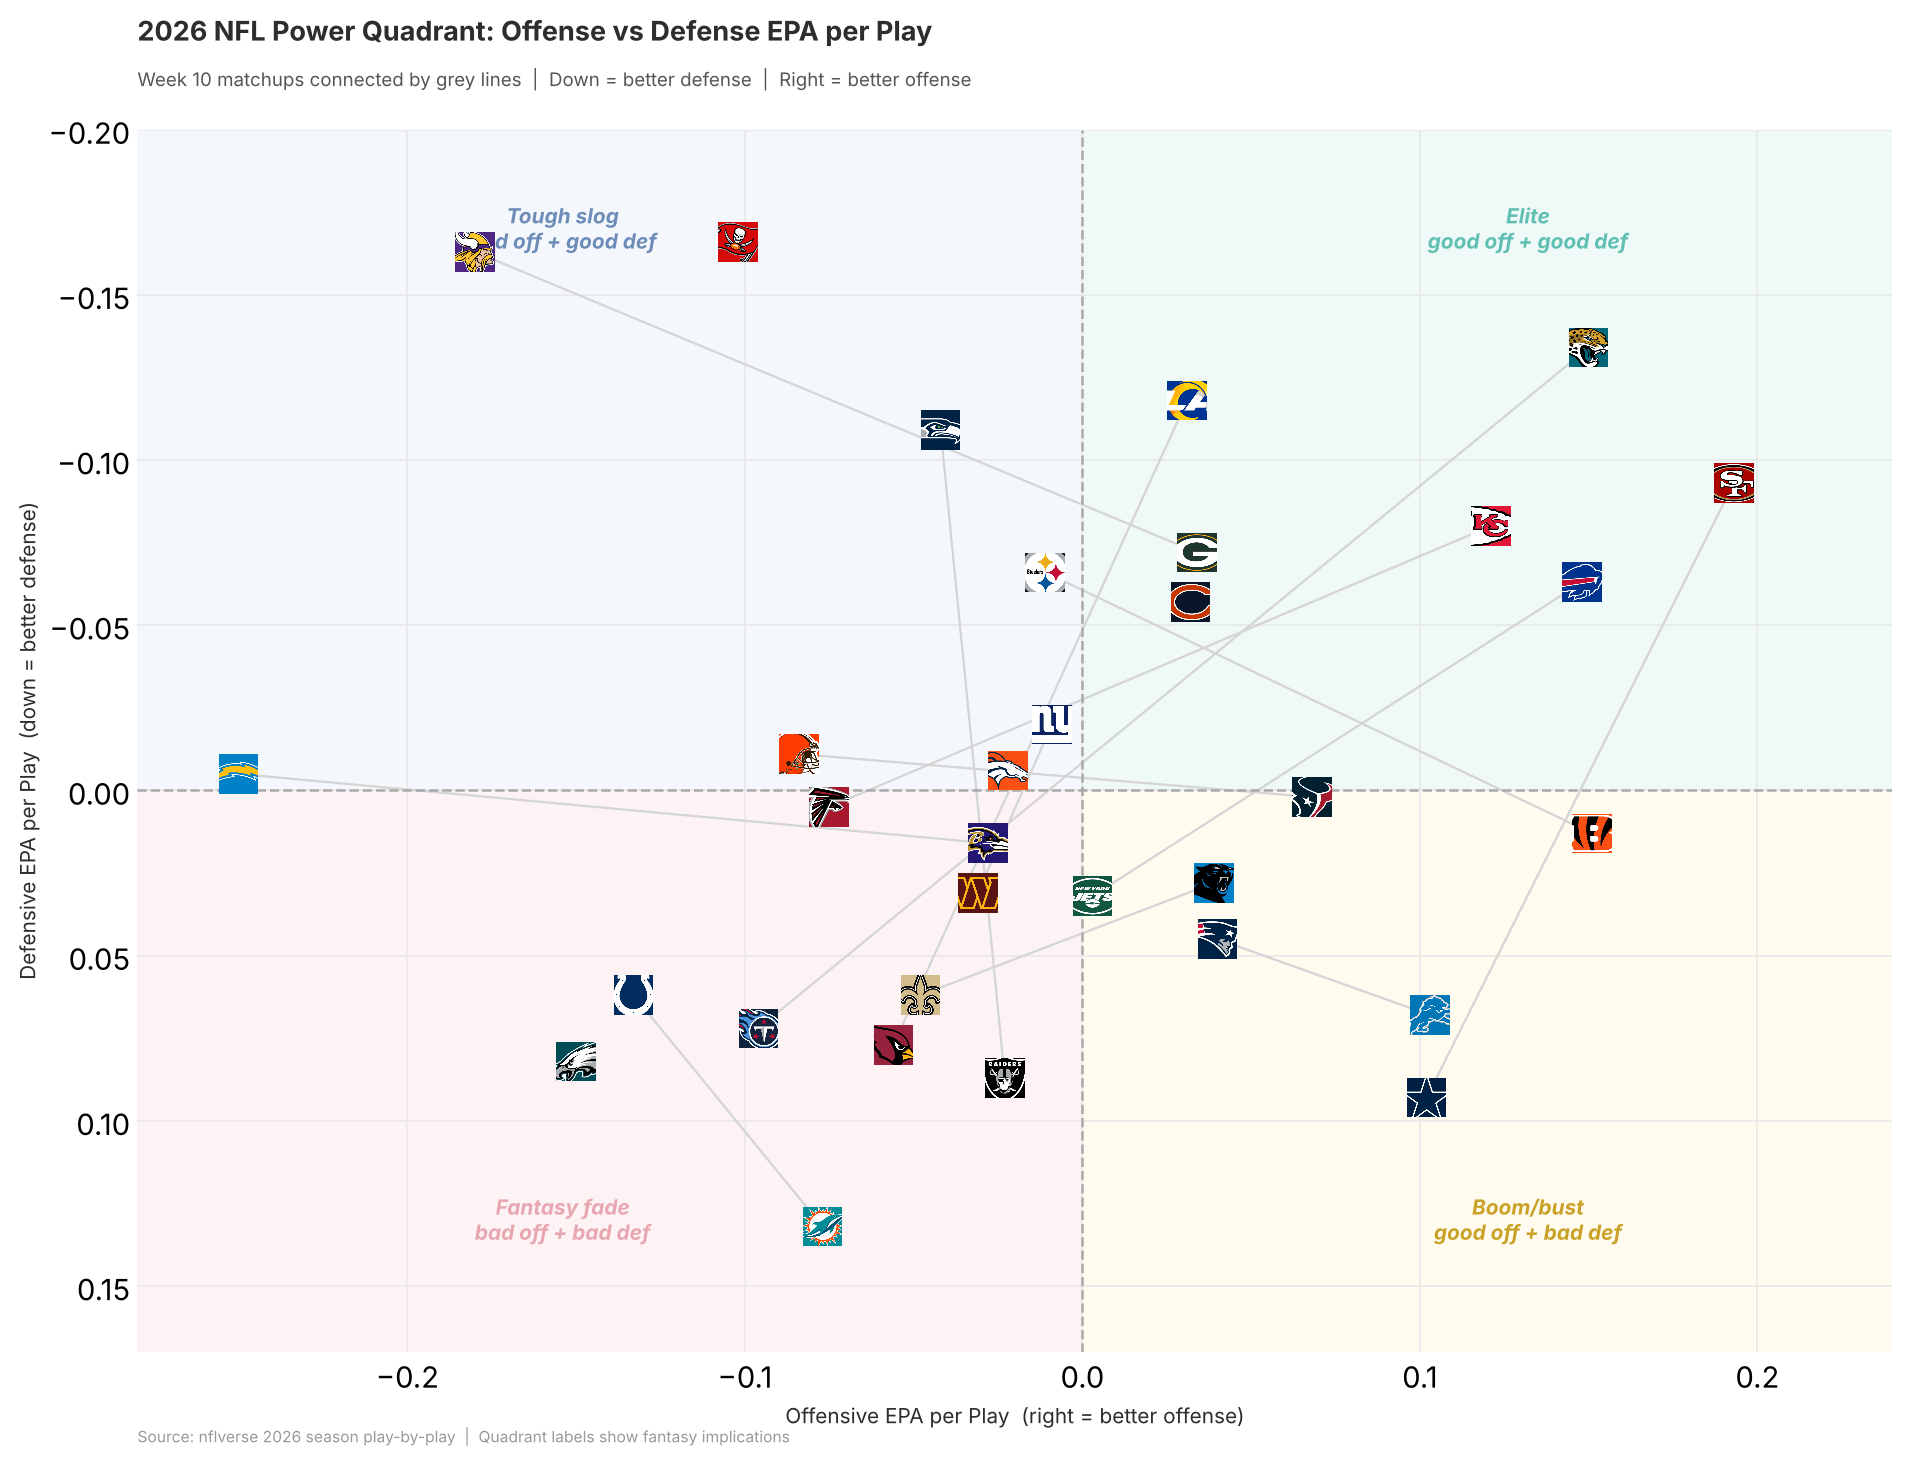
Good luck in Week 10!