
Just the Stats: Usage Trends from Week 9 (Fantasy Football)


Every Monday during the NFL season, I want to give you a blitz of usage stats, scheme changes, and oddities from the previous week of the NFL. The goal is to give you a rapid fire, unfiltered look at how we digest a Sunday’s-worth of action and try to start deciphering what is valuable and what is not.
I wrote a 10 Usage Trends primer article before the season if you want more detail about some of the statistics and examples from the past. This data supplied in the article is noted under each statistic.
IMPORTANT NOTE: This data includes games played from Thursday-Sunday and does not include MNF games.
1st Down Trends from Week 9
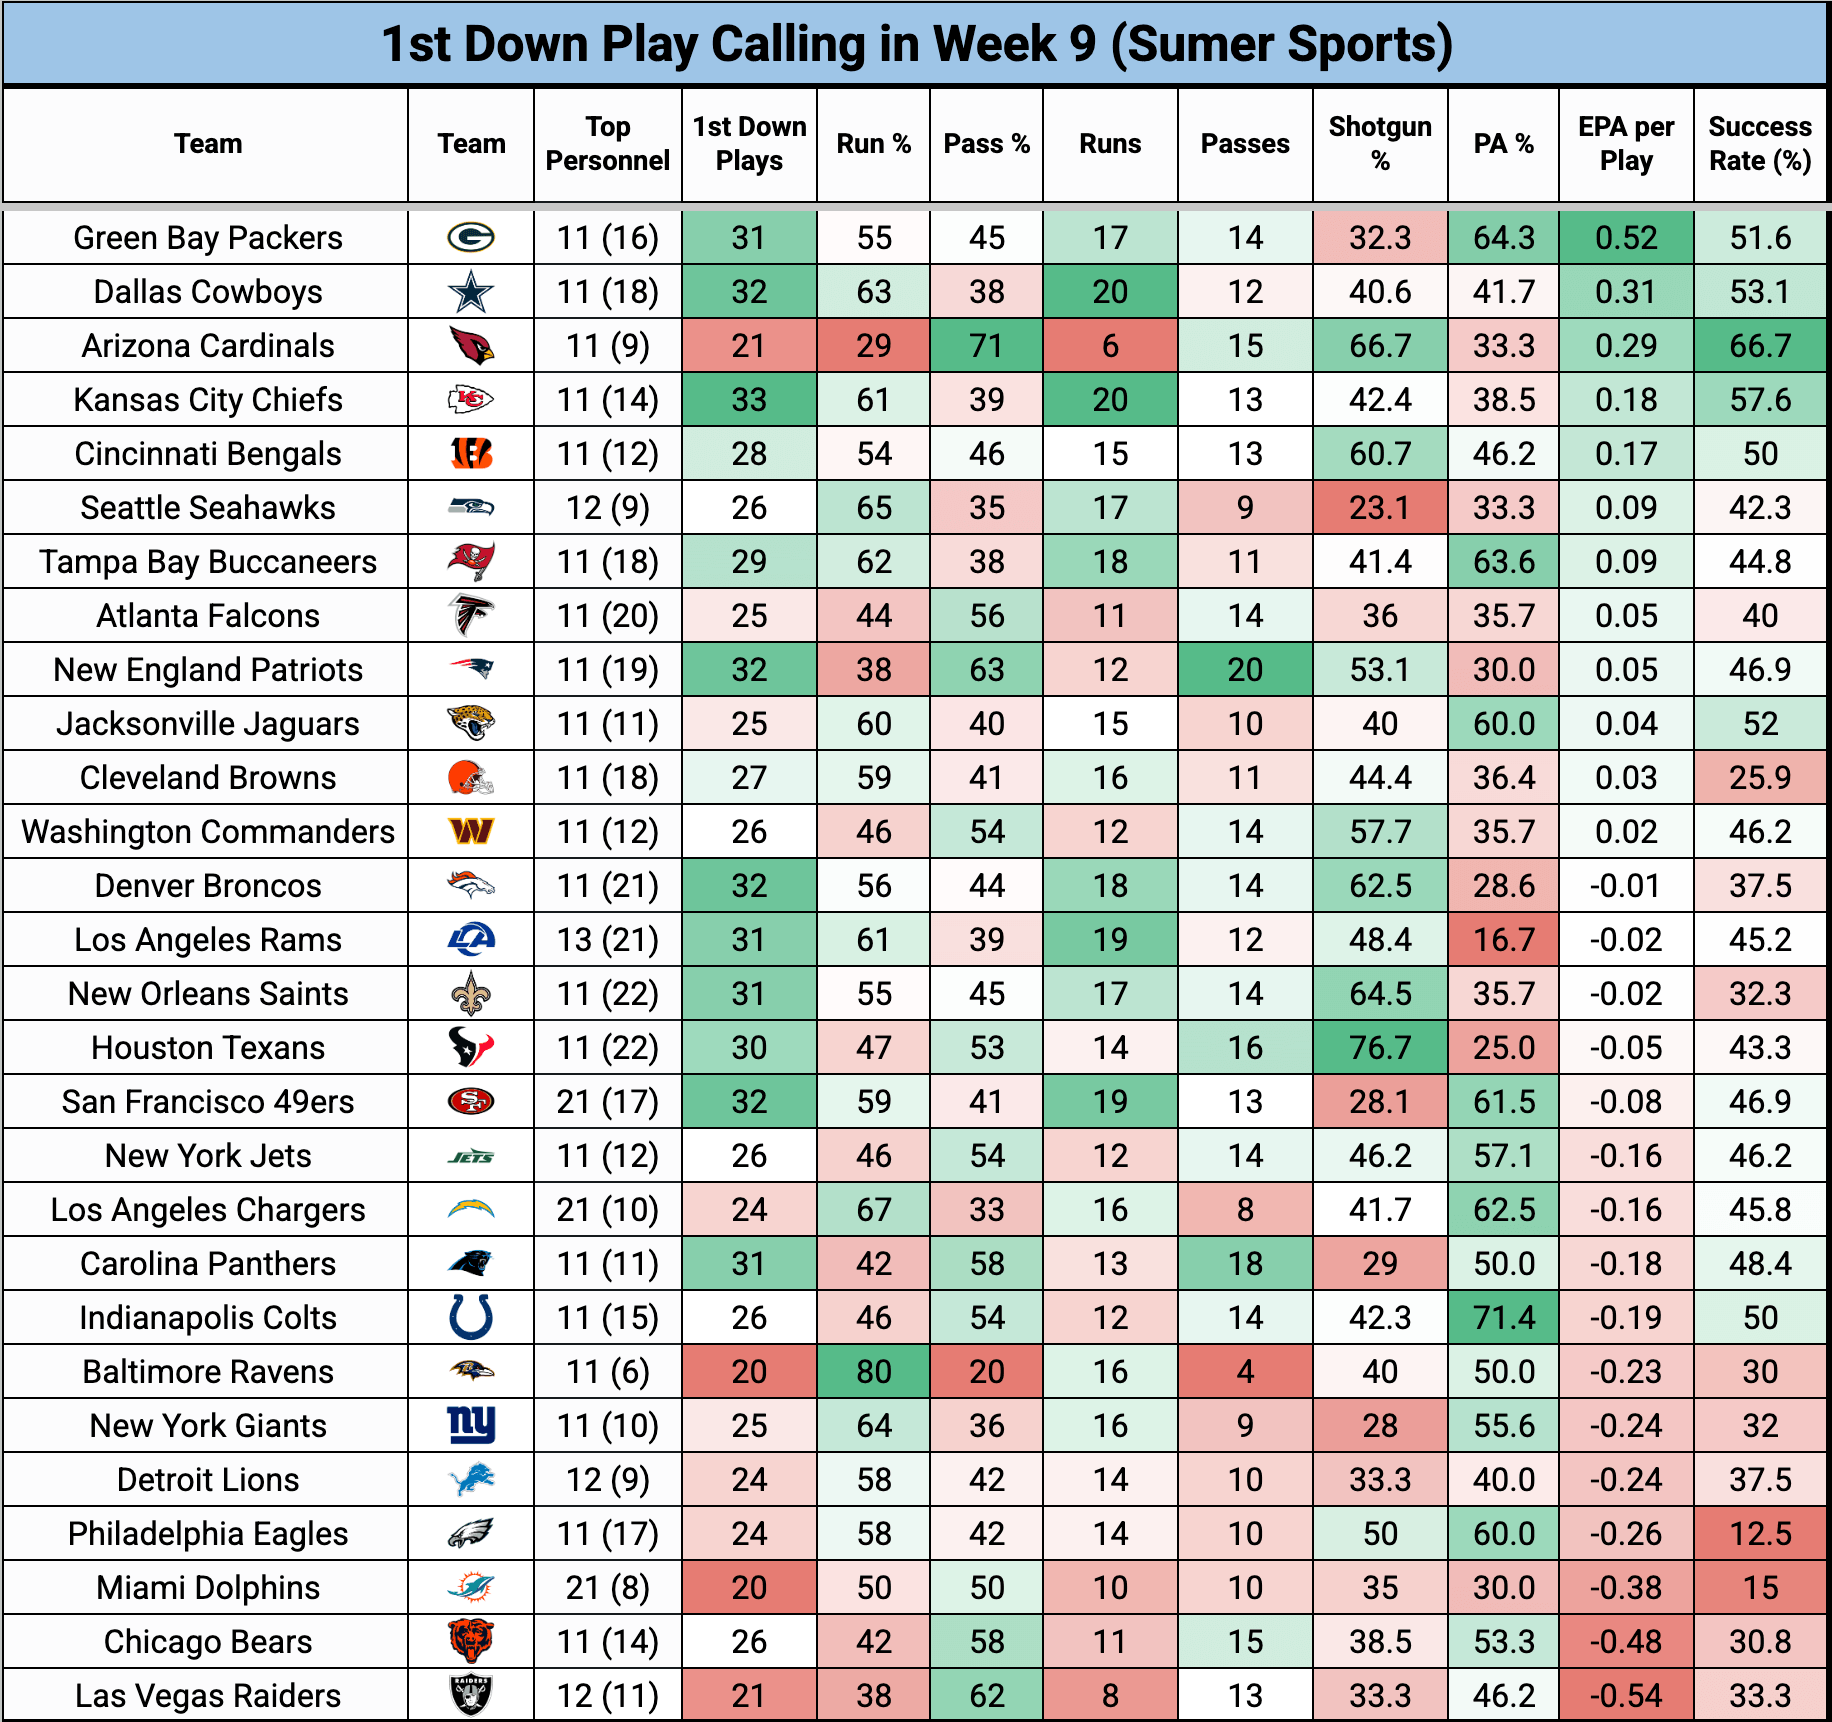
Zeroing on this week, here is how the 28 teams (MIN & BUF pending MNF) decided to attack on 1st downs:
*Data from Sumer Sports
- Green Bay was cooking in Foxboro this week. They ranked #1 in first-down EPA per play (+0.524) using play-action on 64% of its passes thanks to Jordan Love chucking it down field. Love averaged 24.5 yards per attempt on his 12 total downfield passes, the fifth-most in a single game since 2018.
- Despite inching out a last second victory against the Bucs on Sunday night, the Bears ranked 2nd to last in EPA per play on 1st downs. Caleb Williams was blitzed on 26 of 41 drop backs (63.4%) in the Bears’ Week 9 win, tied for the third-most blitzes any quarterback has faced in a game this season.
- The Cardinals threw on a whopping 71% of their 1st downs. It didn’t work as they went scoreless after an early 1st quarter field goal. Gardner Minshew struggled when the Seahawks generated pressure completing just 2 of 6 passes under pressure for 12 yards and taking three sacks.
- How bad was Joe Milton III and the Eagles offense? Their 12.5% play success rate on 1st down was the worst single-game mark of any team this season.
1st Read Target Shares from Week 9
I need to clarify what 1st read target shares are and a few guidelines when using the statistic.
- QB 1st Reads– % of their targets thrown to “1st Reads”
- Receiver 1st Read %– The % of that team’s 1st read targets NOT “he is the 1st read on x% of plays”.
1st Reads are a subset… of a subset. A drop back turns into a pass attempt ≈ 88% of the time. An attempt turns into a 1st read ≈ 67%. Poll NFL play-callers and former QBs they might have a different % to work from.
It is subjective, film-based. I rewatch a lot of film on Mondays/Tuesdays to compare and often find counts can be off here & there. Every stat has some margin for error. No biggie. There is a big difference between what is called in the huddle, what is “looked at” by the QB, what is “open” (very subjective with play/pause nature of film viewing), and what was the true “1st read”.
As with any statistic, it can help build a bridge but it is not the end all.
*Data from Fantasy Points Data Suite
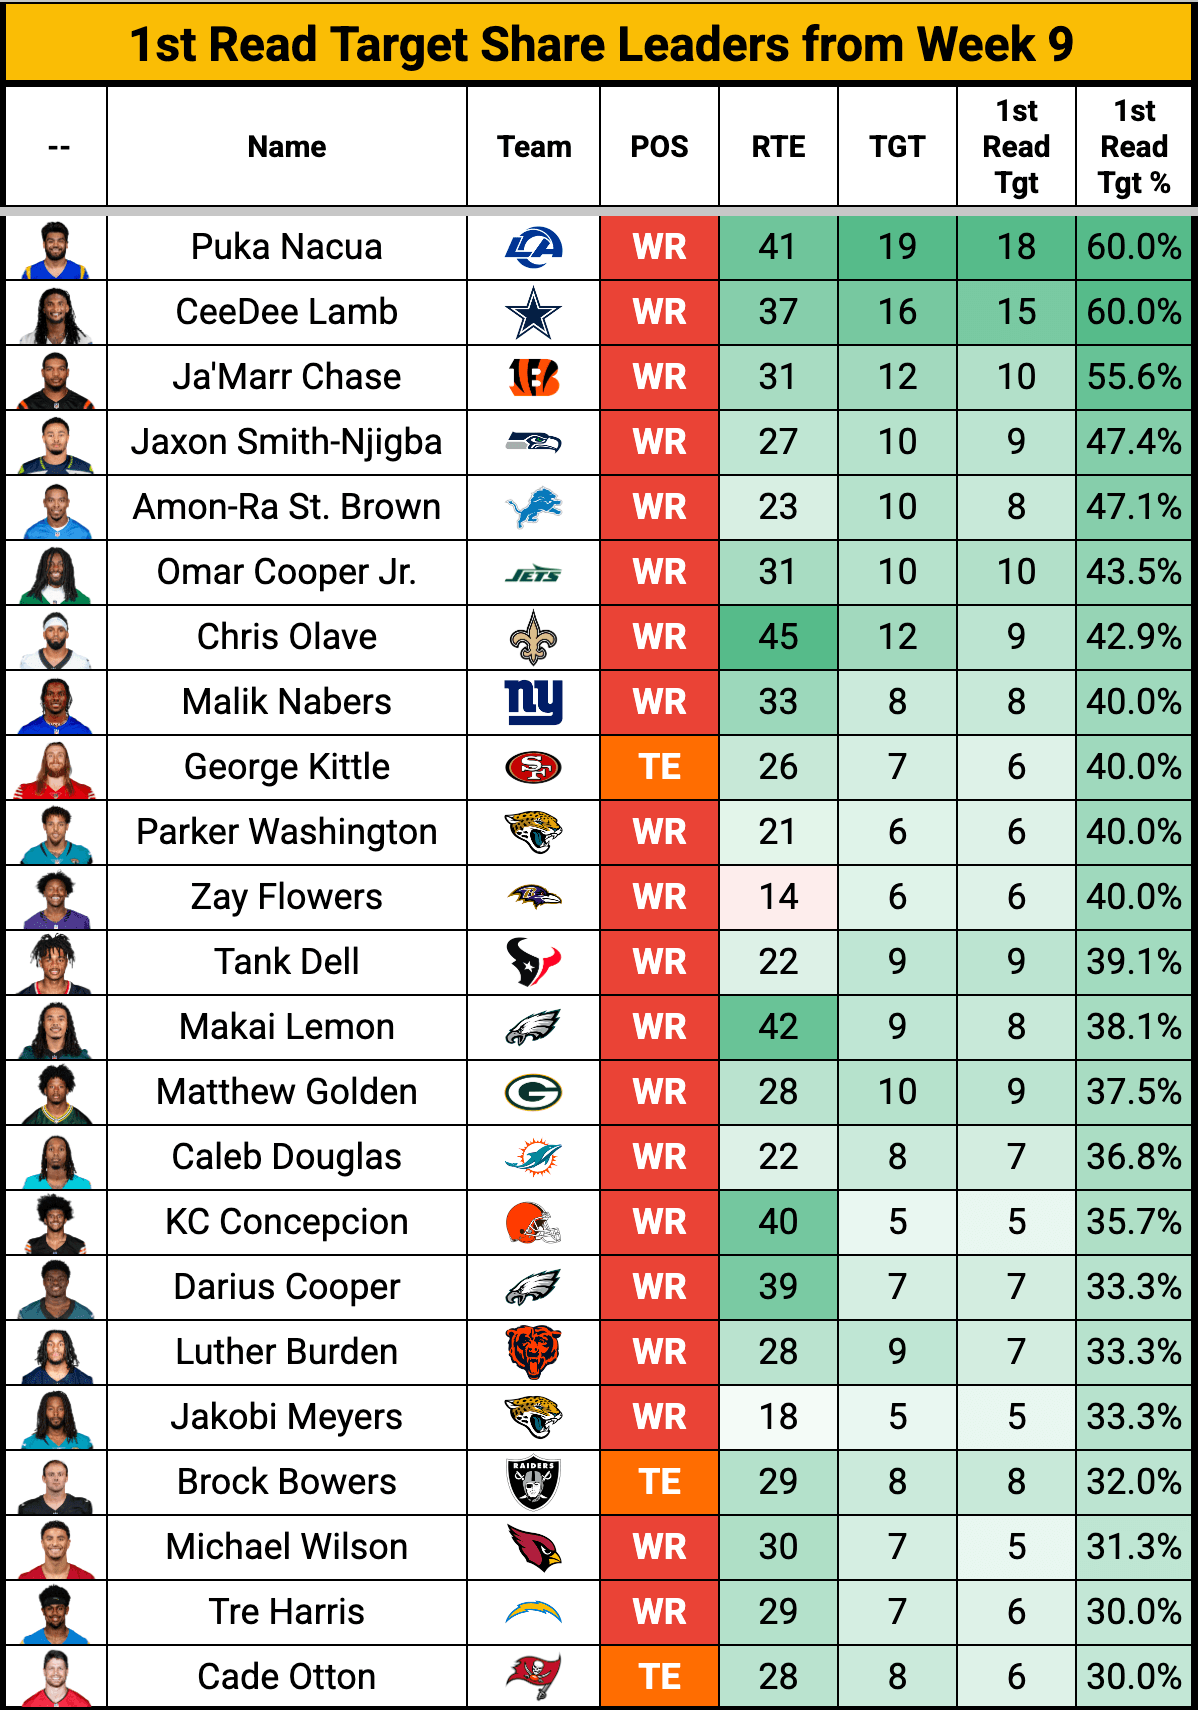
- CeeDee Lamb has 3 of the top-6 highest 1st read target weeks (19, 17, 15) this season with Puka Nacua (21 & 18 this past week) also entering the conversation. It is wild considering Puka has played in only 7 games but his 43.4% 1st read target share on the season is higher than last year’s 37.5%.
- After more than 22 months recovering from a major injury, Tank Dell showed out against the Chargers on Sunday:
Per @SumerSports:
WRs targeted on more than 35% of their routes* in Week 9:
43%- Puka Nacua
42%- CeeDee Lamb
41%- Tank Dell 👀
39%- Ja'Marr Chase
38%- Amon-Ra St. Brown
37%- Jaxon Smith-Njigba*min. 20 routes run
— Kyle Borgognoni (@kyle_borg) November 9, 2026
- Darren Waller, after seeing 6 total targets the previous three weeks, went wild. He was targeted on 34% of his routes, the highest among all TEs in Week 9.
- Over the last month, Luther Burden III‘s 30% 1st read target share is the highest of any 4-game stretch of his career. He also trails only JSN (11) & Ja’Marr Chase (10) in forced missed tackles (9) in that span.
- Emeka Egbuka‘s three 1st read targets were tied with Chris Godwin for 3rd most on the Buccaneers trailing Cade Otton (6) and Tez Johnson (5).
- Harold Fannin Jr.‘s two lone targets came in the final 1:30 of overtime against the Saints. Neither of his targets were 1st read targets. KC Concepcion (36%) and Denzel Boston (29%) were the clear leaders on the team.
1st/2nd Half Splits
I am always curious about this type of data: what happens to my WR in the 2nd half of games? Some teams have various game scripts that suggest they need to throw more and others “turtle up” trying to protect a lead.
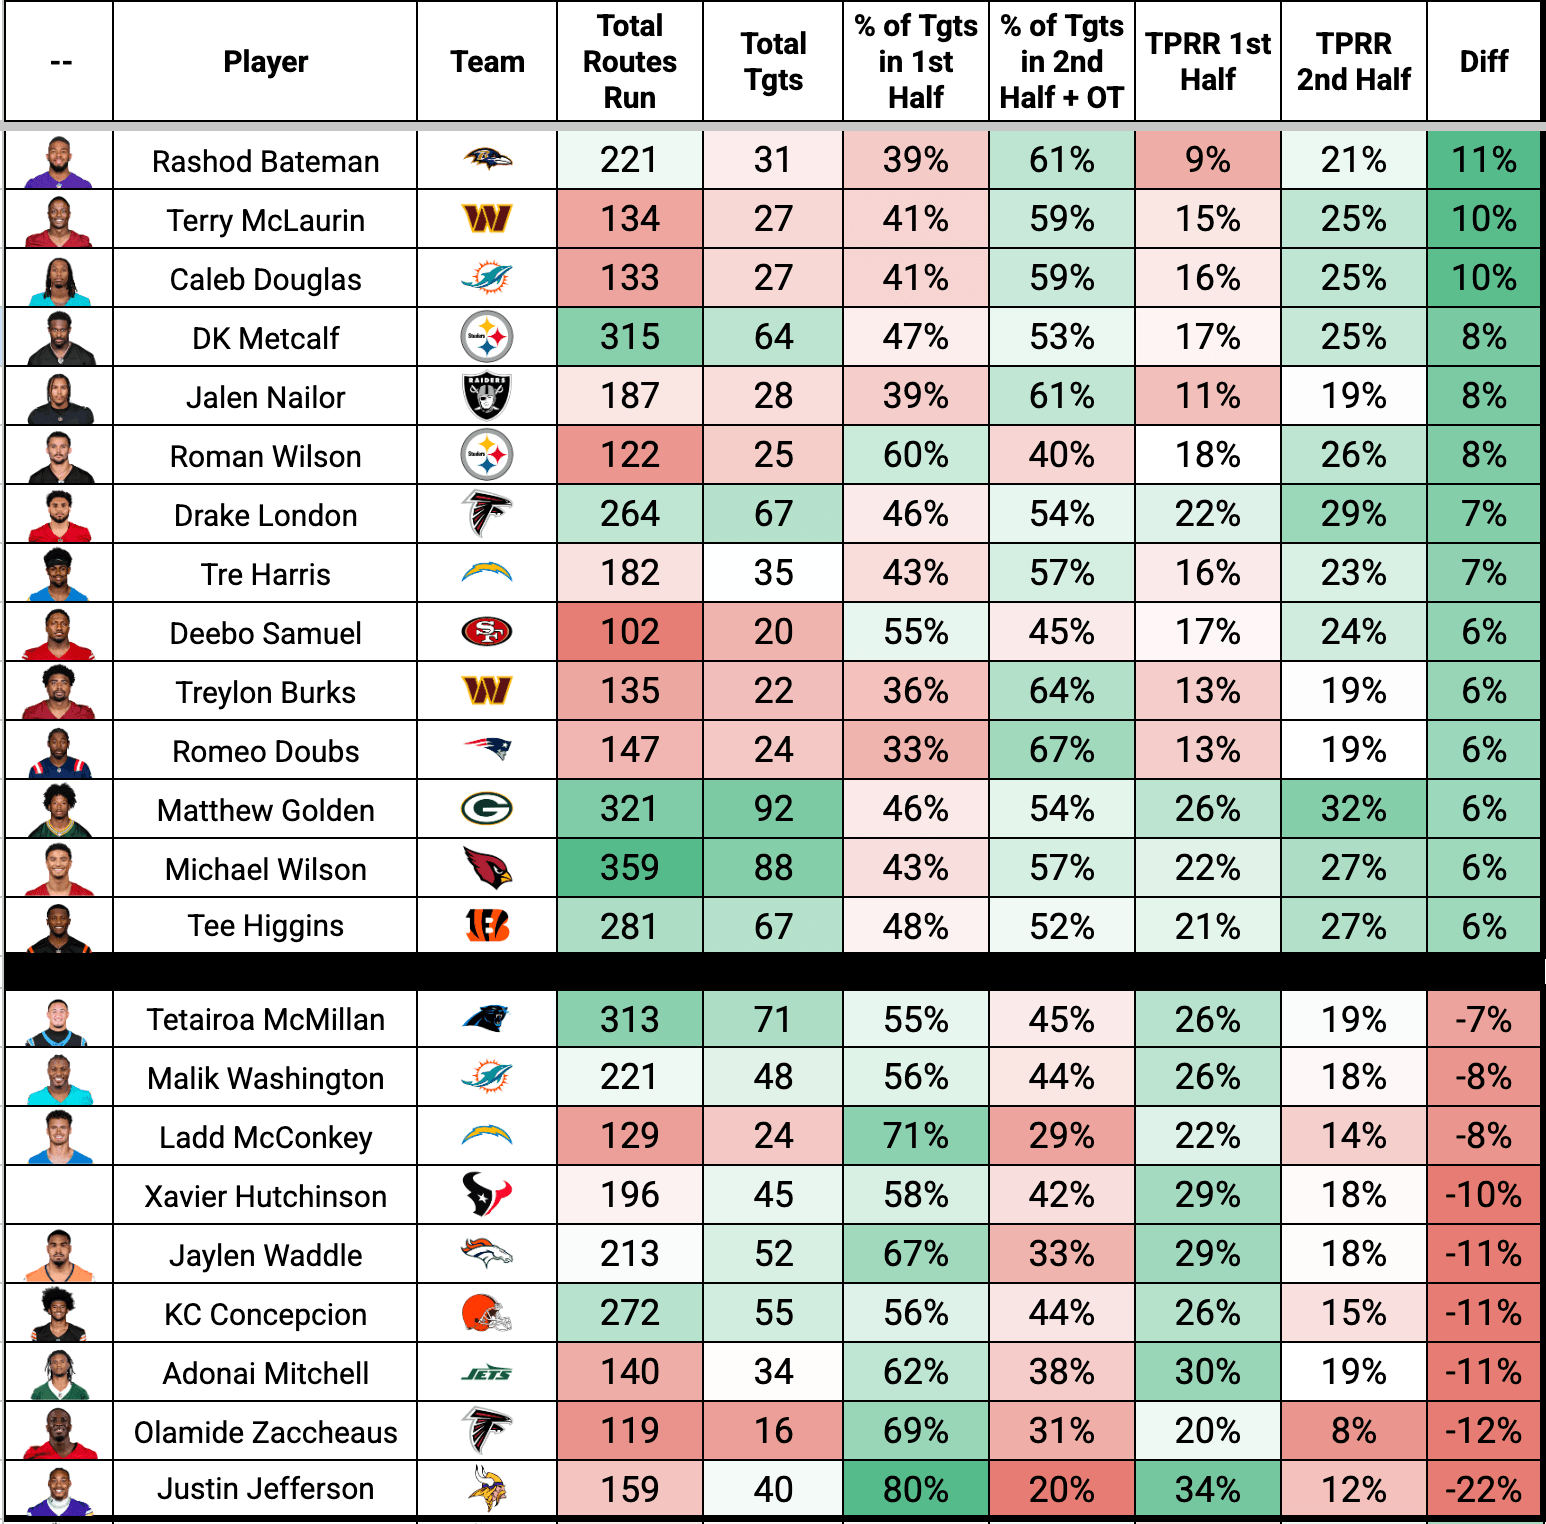
Through nine weeks, here is a comparison of the WRs with the largest deltas between the % of their targets and TPRR coming in the 1st half versus 2nd half + OT:
*Data from Sumer Sports
- Caleb Douglas has emerged as perhaps the best fantasy option among Dolphins WRs. He was targeted on all four of his out routes in Week 9 against the Lions (catching three of them for 38 yards) and now has 128 yards on out routes (7th-most among all WRs).
- Christian Watson (171) and Matthew Golden (164) each set new career highs in receiving yards and had a receiving touchdown in the Packers’ Week 9 win over the Patriots.
They are the first teammate duo in the NFL with 150+ receiving yards and a receiving touchdown in the same game since CeeDee Lamb and Brandin Cooks in 2023. - Justin Jefferson might be the wildest name on this list. 80% of his targets have come in the 1st half of games and he has been targeted on just 12% of his 40 2nd half routes.
Context for Jefferson's numbers in terms of comparable TPRR usage ⬇️
1st Half (34%): Puka/JSN/CD
2nd Half (12%): Mooney/Dotson/Treadwell https://t.co/l3cOucTDGv— Kyle Borgognoni (@kyle_borg) November 9, 2026
- Tetairoa McMillan is a curious case of having a ton of production in a small window despite being the WR13 on the season. His Week 4 game against the Lions is doing a ton of the heavy lifting accounting for 37.6% of his fantasy points!
I had to finish the drill and include the TEs in the same comparison:
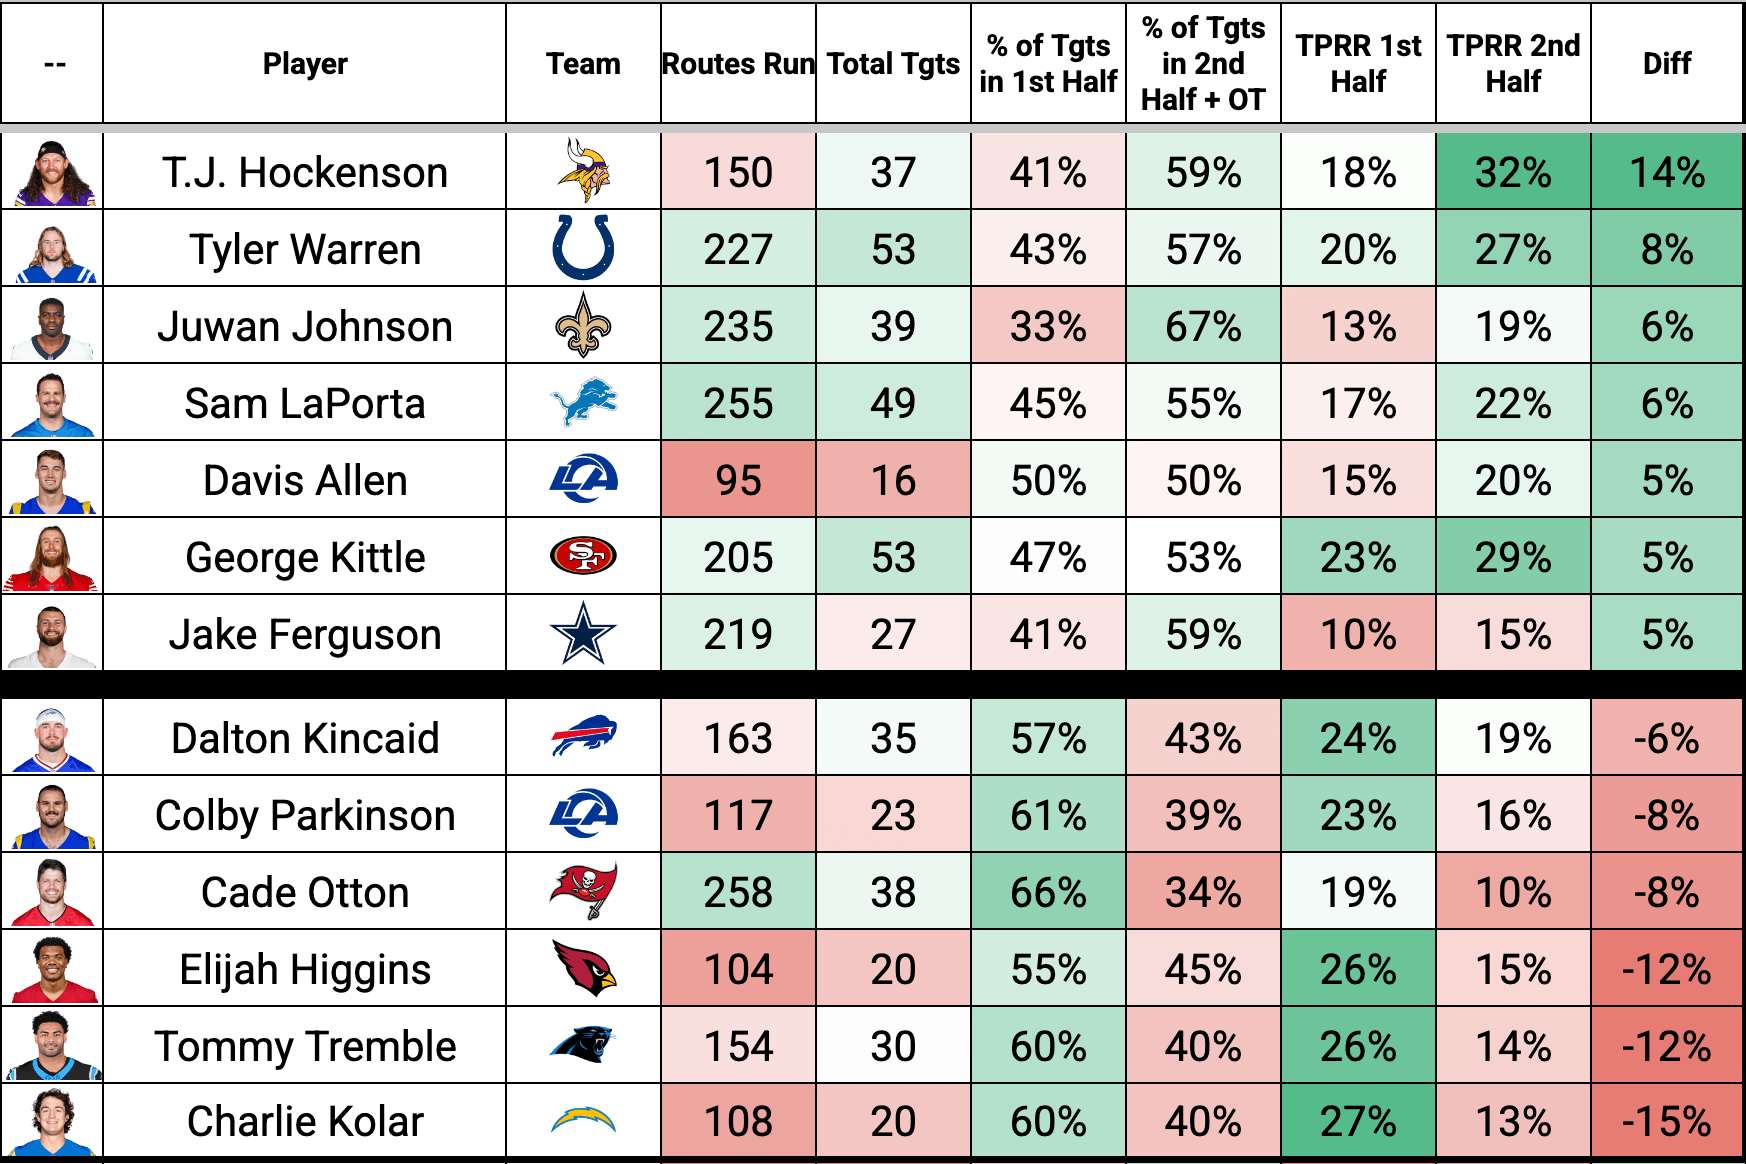
- It makes sense that TJ Hockenson would see a boost if Jefferson’s usage dips at the end of games. Hockenson’s 32% TPRR in the 2nd half of games leads all TEs in the NFL.
- Tyler Warren‘s is significant when you take this a step further and remember how 2025 went for him as a rookie. The Colts were cruising at the beginning of the year until Daniel Jones injury. Last year, 62% of his fantasy points came in the 1st half of games, that was the 2nd HIGHEST of any WR/TE in football.
- George Kittle‘s 3.58 YPRR in the 2nd half leads all TEs. 4 of his 5 receiving TDs have come in the second half of games.